Key takeaways
- Traditional SEO metrics (rankings, clicks) don't capture AI search performance -- you need a separate reporting framework built around citations, share of voice, and prompt visibility
- The best client reports lead with business outcomes first, then support them with AI-specific metrics like mention rate, citation frequency, and sentiment
- Tracking across multiple AI models (ChatGPT, Perplexity, Google AI Overviews, Claude, Gemini) matters because your clients' customers use all of them
- A good report doesn't just show where a client is invisible -- it shows what to do about it, with specific content gaps and recommendations
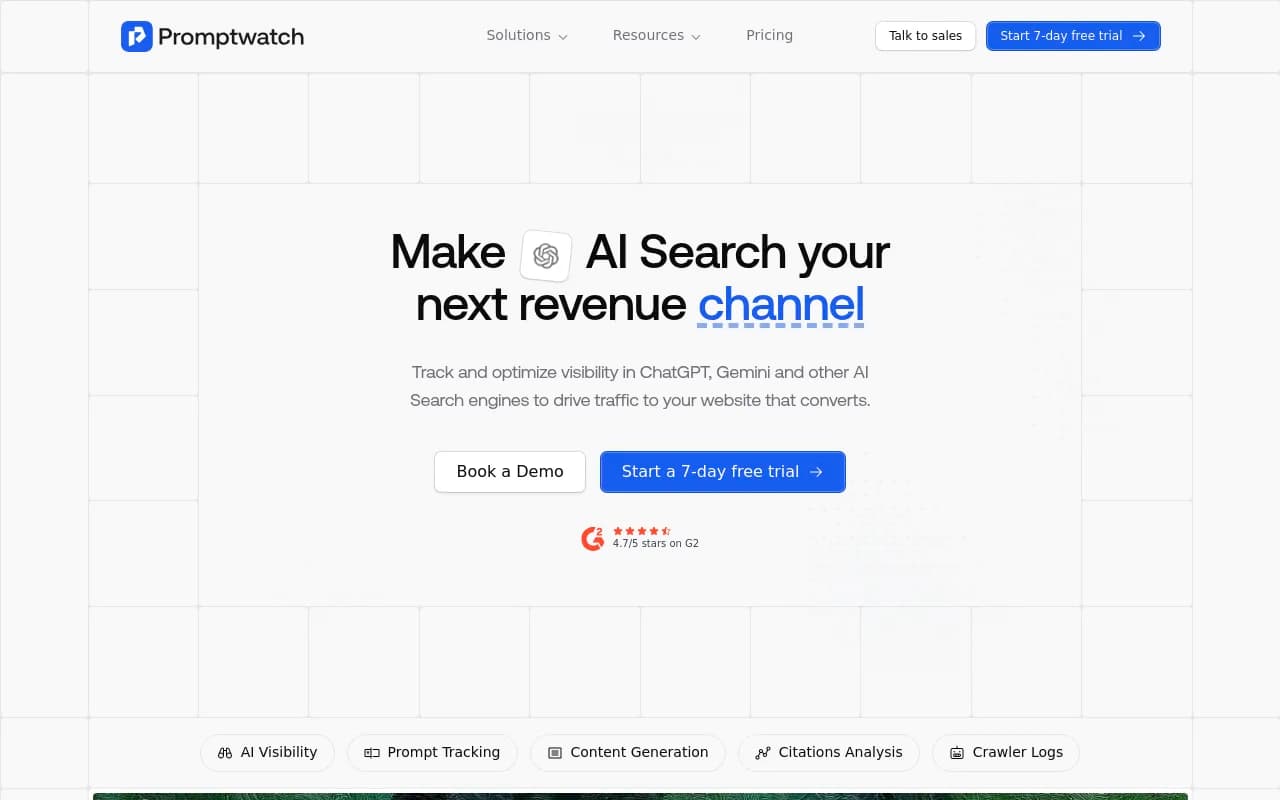
- Tools like Promptwatch go beyond monitoring to help you close the loop: find gaps, generate content, and track improvement over time
Most AI visibility reports land in a client's inbox and go straight to the "I'll read this later" pile. You know the ones -- walls of numbers, unfamiliar metrics, no clear narrative. The client nods politely on the call, asks "so is this good or bad?", and you spend 20 minutes explaining what share of voice means.
That's a reporting problem, not a data problem. The data is there. The issue is how it gets packaged.
This guide walks through how to build an AI search visibility report that clients actually engage with -- one that tells a story, connects to revenue, and gives them something to act on.
Why AI search visibility needs its own reporting layer
For years, the standard client report covered organic rankings, traffic, and conversions. Those metrics still matter. But they miss something significant: whether your client's brand shows up when someone asks ChatGPT, Perplexity, or Google's AI Mode for a recommendation.
Over 40% of searches now involve some form of AI-generated answer, according to data from Frase's 2026 analysis of the AI visibility tool market. That number is growing. And the brands that appear in those answers aren't necessarily the ones ranking #1 in traditional search -- they're the ones whose content AI models have read, understood, and decided to cite.
If you're only reporting on traditional SEO, you're showing clients half the picture. Worse, you might be showing them a picture that looks fine while a competitor quietly dominates every AI recommendation in their category.
The anatomy of a good AI visibility report
Before you pick tools or pull data, decide what story you're trying to tell. Every section of the report should answer one of three questions:
- Where does the client stand right now?
- What changed since last period?
- What should happen next?
Reports that only answer question one are dashboards. Reports that answer all three are useful.
Section 1: Executive summary (one page, plain language)
Start with a summary written for someone who doesn't know what a citation rate is. Three to four bullet points max:
- "Your brand appeared in X% of AI responses when customers searched for [category] -- up from Y% last month"
- "ChatGPT cited your content 47 times this month. Perplexity cited it 12 times."
- "Competitor A now appears in 2x more AI responses than you for [specific topic]"
- "We identified 8 content gaps that, if addressed, could improve your AI visibility by an estimated 30%"
The goal is to make the client feel informed in 60 seconds. Everything else in the report is backup.
Section 2: Share of voice across AI models
This is your headline metric. Share of voice (SOV) measures how often your client's brand appears in AI responses compared to competitors, across a defined set of prompts.
The key word is "across." Different AI models behave differently. ChatGPT might favor your client's content while Perplexity consistently recommends a competitor. Google AI Overviews might pull from a completely different set of sources than Claude. Reporting on only one model gives a misleading picture.
A useful SOV table looks something like this:
| AI model | Client SOV | Competitor A SOV | Competitor B SOV | Change vs. last month |
|---|---|---|---|---|
| ChatGPT | 34% | 28% | 18% | +6% |
| Perplexity | 19% | 41% | 22% | -3% |
| Google AI Overviews | 27% | 31% | 15% | +2% |
| Claude | 22% | 25% | 20% | +1% |
| Gemini | 30% | 27% | 19% | +4% |
Clients immediately understand this. They can see where they're winning, where they're losing, and whether things are moving in the right direction.
Section 3: Citation and mention breakdown
Share of voice tells you the "what." Citations tell you the "why."
A citation is when an AI model links to or specifically references a piece of your client's content. A mention is when the brand name appears in an AI response without a direct link. Both matter, but citations carry more weight -- they signal that the AI model trusts your content enough to send users there.
Report on:
- Total citations this period vs. last period
- Which pages are being cited most often
- Which AI models are doing the citing
- Any pages that were cited before but have dropped off (a warning sign)
The page-level data is particularly valuable for clients. When you can say "your pricing page is being cited by ChatGPT in 23% of purchase-intent queries," that's a concrete, meaningful finding. When you can say "your blog post on [topic] stopped being cited after the March update," that's an actionable problem.
Section 4: Prompt-level visibility
This section shows which specific questions or prompts your client appears in -- and which ones they're missing.
Think about how your client's customers actually use AI search. They don't type keywords. They ask questions: "What's the best [product category] for [use case]?" or "Which [service type] companies are worth considering?" or "Compare [client] vs [competitor]."
Map out 20 to 50 of these prompts and track visibility for each one. Then segment them:
- Prompts where the client appears consistently
- Prompts where the client appears sometimes
- Prompts where the client never appears (the gaps)
The gaps section is where the report gets interesting. These are real queries that real customers are asking, where a competitor is getting the recommendation instead. That's lost revenue with a clear fix.
Section 5: Sentiment and context
Appearing in an AI response isn't always good. If ChatGPT mentions your client's brand in the context of "some users have reported issues with..." that's worse than not appearing at all.
Include a brief sentiment breakdown:
- Positive mentions (recommended, cited as a solution, listed as a top option)
- Neutral mentions (listed among many options without clear preference)
- Negative or cautionary mentions (flagged for issues, compared unfavorably)
Most clients haven't thought about this dimension. Introducing it usually sparks a productive conversation about brand reputation and content strategy.
Section 6: Competitive intelligence
Clients want to know what competitors are doing. This section answers: "What are they doing that we're not?"
Look at which content pieces competitors are getting cited for, which prompts they dominate, and whether there are topics they own completely that your client hasn't addressed. This isn't about copying -- it's about identifying the content gaps that are costing your client visibility.
A simple competitive heatmap works well here:
| Prompt category | Client | Competitor A | Competitor B |
|---|---|---|---|
| Product comparisons | Medium | High | Low |
| How-to guides | High | Medium | Medium |
| Pricing questions | Low | High | Low |
| Use case queries | Medium | Medium | High |
| Brand vs. brand | Low | High | Medium |
Section 7: Recommendations and next steps
This is the section most reports skip or bury at the end with vague suggestions. Don't do that.
Be specific. For each gap you've identified, name the content that needs to be created or updated, which AI models it's most likely to affect, and what the expected impact is. Clients don't need a 10-point action plan -- they need three clear priorities with enough context to make a decision.
Choosing the right tools to power your reports
The quality of your report depends heavily on the quality of your data. Manual tracking across five AI models with 50 prompts is theoretically possible but practically unsustainable. You need tooling.
Here's how the main options compare:
| Tool | Multi-model tracking | Citation tracking | Content gap analysis | Content generation | Crawler logs | Best for |
|---|---|---|---|---|---|---|
| Promptwatch | 10 models | Yes (page-level) | Yes | Yes (AI agents) | Yes | Agencies & brands wanting full action loop |
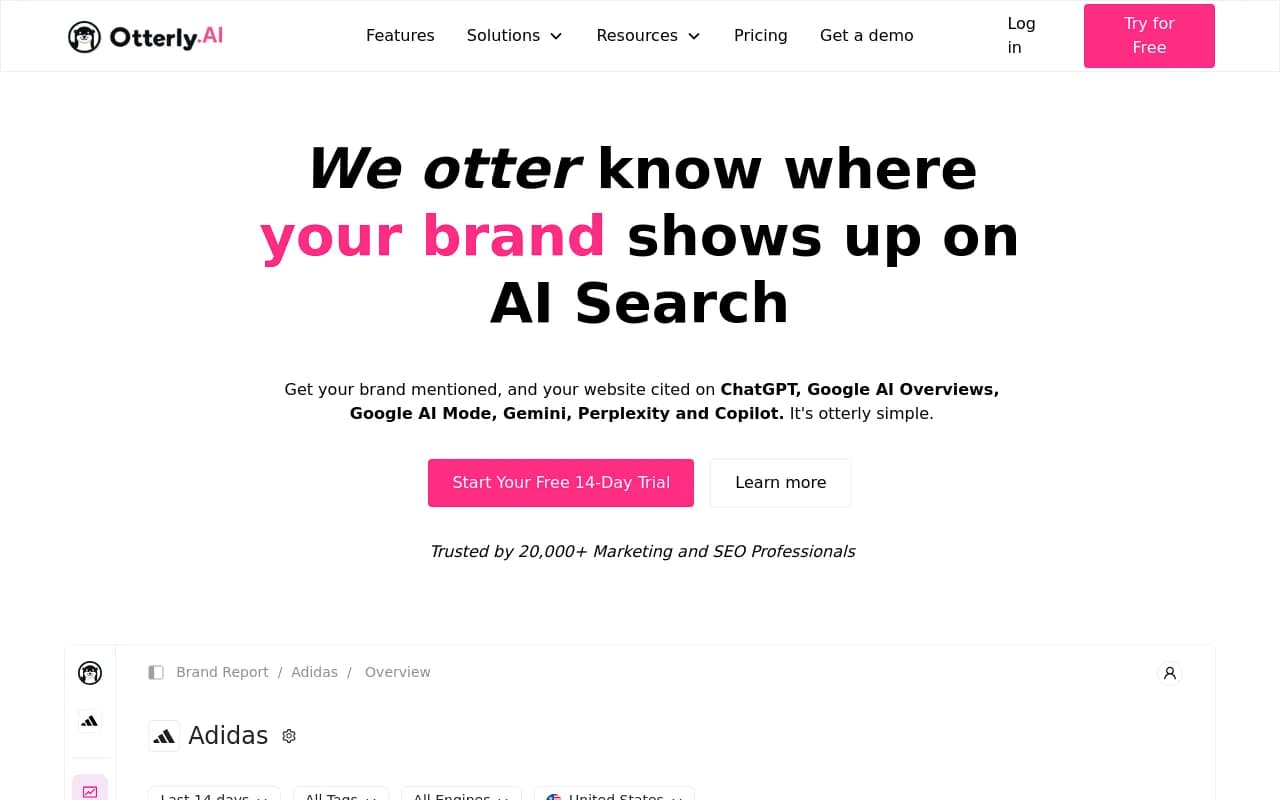
| Otterly.AI | Limited | Basic | No | No | No | Budget monitoring |
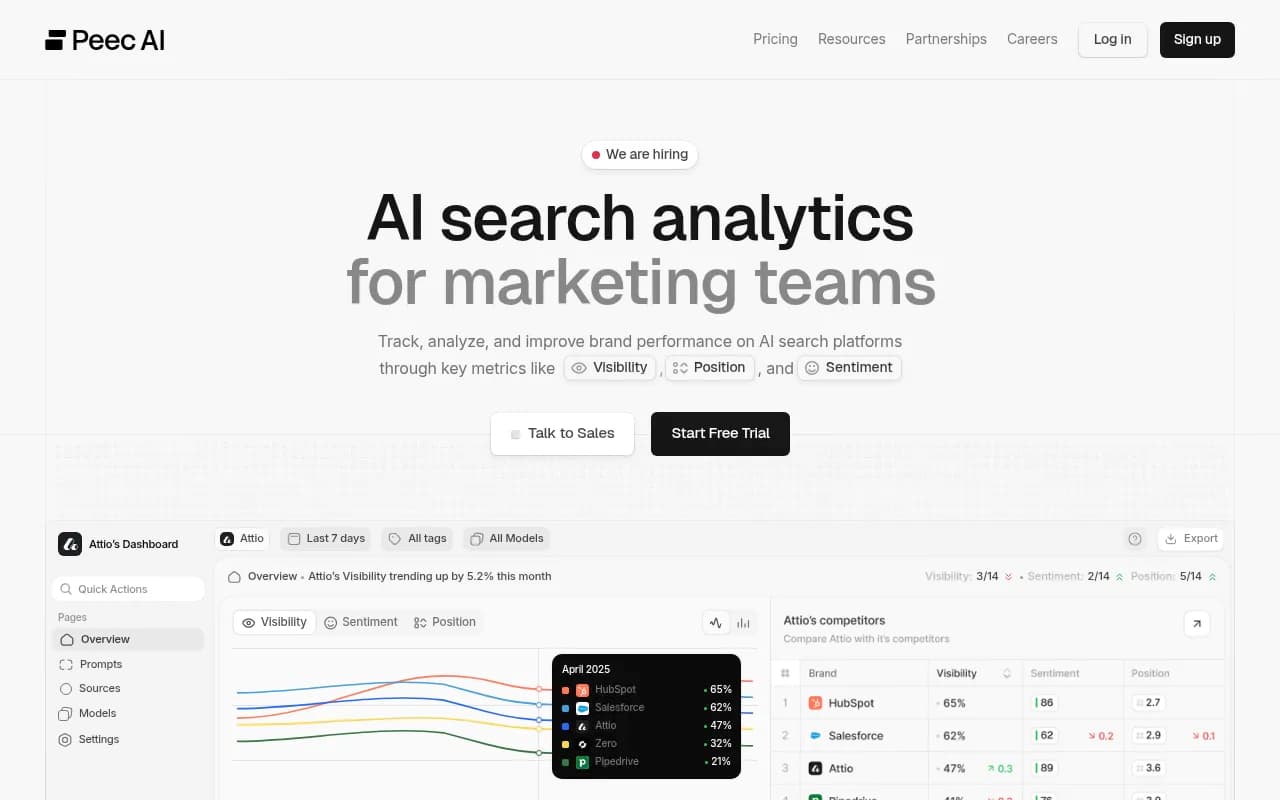
| Peec AI | Yes | Basic | No | No | No | Simple monitoring |
| Profound | Yes | Yes | Limited | No | No | Enterprise monitoring |
| SE Ranking | Yes | Yes | Limited | No | No | SEO teams |
| Scrunch AI | Yes | Yes | No | No | No | Brand monitoring |
| Athena HQ | Yes | Yes | No | No | No | Monitoring-focused teams |
Promptwatch is worth calling out specifically because it's built around the full reporting cycle rather than just data collection. You can track visibility across 10 AI models, see which pages are being cited and why, identify the exact prompts where competitors are winning, and then generate content to close those gaps -- all in one platform. For agencies building client reports, the page-level citation tracking and competitor heatmaps are particularly useful for the sections described above.
For teams that want monitoring without the optimization layer, Otterly.AI and Peec AI are lighter options:
For enterprise clients with larger budgets and more complex needs, Profound and SE Visible offer strong monitoring capabilities:
How to structure the reporting cadence
One report doesn't tell a story. A series of reports does.
Monthly reports work well for most clients. They're frequent enough to show momentum, infrequent enough that meaningful changes have time to register. AI models don't re-crawl content daily -- a new article you publish today might not appear in AI responses for two to four weeks.
Within your monthly cadence, consider:
- A brief weekly check on share of voice for the top 10 prompts (takes 15 minutes with the right tool, gives you early signals)
- A monthly full report covering all sections above
- A quarterly review that steps back and looks at trends, competitive positioning, and strategic priorities
The weekly check is mostly for your own awareness -- you don't need to send it to clients unless something significant happens. The monthly report is your main deliverable. The quarterly review is where you have the strategic conversation about what to do next.
Common mistakes that make reports useless
Reporting on too many metrics
More data doesn't mean more insight. A report with 40 metrics is harder to understand than one with 8. Pick the metrics that matter most for your client's goals and cut the rest. If a client is focused on brand awareness, lead with share of voice. If they're focused on purchase-intent queries, lead with citation rates for bottom-of-funnel prompts.
Treating all AI models equally
A B2B software company's customers probably use Perplexity and ChatGPT more than Grok or Meta AI. A consumer brand might see the opposite. Weight your reporting toward the models your client's actual customers use. If you don't know yet, track all of them for the first two months and let the data tell you where to focus.
Showing raw numbers without context
"Your brand was cited 47 times" means nothing without context. Is that good? Is it up or down? How does it compare to competitors? Every number in your report should come with a comparison -- either to a previous period, a competitor, or an industry benchmark.
Ignoring the content connection
AI visibility isn't a mysterious black box. It's largely driven by content -- what you've published, how well it answers specific questions, whether AI models can find and parse it. When you show a client a gap, connect it to a specific content action. "You're not appearing in responses about [topic] because you don't have a page that directly addresses it" is a much more useful finding than "your visibility for [topic] is low."
Not explaining what AI search actually is
Some clients still don't fully understand what AI search visibility means. Spend two minutes at the start of every report call explaining it: "When your customers ask ChatGPT for a recommendation, this is whether your brand shows up in the answer." That context makes everything else in the report land better.
A note on connecting AI visibility to revenue
The hardest part of AI search reporting is attribution. When a customer asks Perplexity for a recommendation, gets your client's name, visits the website, and converts -- that journey is mostly invisible to traditional analytics.
Some tools are starting to close this gap. Promptwatch, for example, connects AI crawler logs to actual site traffic, so you can see when an AI model crawls a page and then track whether that correlates with traffic and conversion patterns. It's not perfect attribution, but it's directional.
For now, the most honest approach is to show clients the leading indicators (share of voice, citation rate, prompt visibility) and explain that these are upstream of revenue. The same way a brand might track TV ad reach knowing that not every viewer becomes a customer, AI visibility metrics tell you about exposure and influence at the top of the funnel.
As the tooling matures, revenue attribution will get cleaner. For 2026, focus on showing clients that their AI visibility is moving in the right direction and connecting that to the content investments you're making on their behalf.
Putting it all together: a report template outline
Here's a simple structure you can adapt for any client:
Page 1: Executive summary
- 3-4 bullet points in plain language
- One chart showing overall SOV trend
Page 2: Share of voice by AI model
- Table comparing client vs. top 2-3 competitors across 5+ models
- Month-over-month change highlighted
Page 3: Citation breakdown
- Total citations this month vs. last month
- Top 5 cited pages
- Pages that dropped off the citation list
Page 4: Prompt visibility
- Top performing prompts
- Prompts where visibility is declining
- New gaps identified this month
Page 5: Competitive intelligence
- What competitors are being cited for that the client isn't
- Heatmap of prompt categories
Page 6: Recommendations
- 3 specific content actions with expected impact
- Timeline and ownership
Six pages. Thirty minutes to present. Clients leave the call knowing exactly where they stand and what happens next.
That's the goal. Not a comprehensive data dump -- a clear story with a clear direction.
Tools worth exploring for your reporting stack
Beyond the core tracking platforms, a few other tools can help you build better reports and close the loop between visibility data and content action:
AgencyAnalytics is worth a look specifically for the reporting layer -- it handles multi-client dashboards well and can pull in data from multiple sources. Pair it with a dedicated AI visibility tracker and you have a solid agency reporting stack.
The field is moving fast. New tools are launching every month, and the platforms that exist today will look quite different by the end of 2026. The underlying framework for what makes a good report -- clear story, business context, specific recommendations -- won't change. Build your process around that, and the tooling becomes interchangeable.