Key takeaways
- Comparison pages are a small share of ChatGPT citations overall (5.9%) but rise to 7.9% for commercial prompts, and they last: 72% were still cited after 30 days.
- AI models cross-check claims across sources. A page where every row favors you gets discounted, so honest tradeoffs are a citation strategy, not just good manners.
- Use a real table, specific measurable claims, and a plain 'choose X if, choose Y if' verdict.
- If you don't publish the 'You vs. Rival' page, the AI builds its table from sources that did, and your competitor's framing becomes the answer.
- Treat comparison pages as evergreen assets: update prices and specs, and check what ChatGPT cites alongside you.
Why comparison pages matter more than their citation share suggests
Most marketers still write comparison pages as sales pages in a table costume. Every cell is a checkmark for them and an X for the rival. Readers see through it in about five seconds. AI models see through it too.
The numbers say comparison pages deserve attention, even if they aren't the biggest slice. In Promptwatch Data's content type report (Sep 28 to Oct 4, 2026), comparisons earned 5.9% of ChatGPT citations. Product pages took 22.4%, landing pages 16.8%, and listicles 13.6%. So comparisons aren't the main event.
But look at commercial prompts, the "best CRM for small businesses" kind of question. There, comparisons climb to 7.9%. People who are about to buy are exactly the people asking for side-by-side answers.
Then there is longevity. In Promptwatch's content half-life study, which tracked every page ChatGPT cited on July 6, 2026 for 90 days, 72% of comparison pages were still cited after 30 days and 63% after 60. News pages, by contrast, lost half their cited pages within 36 days. A comparison page is closer to a long-term asset than a campaign.
Finally, ChatGPT almost never settles a comparison with one source. According to Promptwatch's unique domains report, 49.1% of competitor comparison prompts (think "Asana vs Monday.com") cite 10 or more domains, and only 0.35% cite a single one. Your competitor's site will probably be cited right next to yours. Your job is to make your page the one that's easiest to quote accurately.
What AI models look for in a comparison
The research from Unusual, Duda, Skayle and others is mostly practitioner advice, not measured data, so treat it as informed opinion. Still, it converges on the same few ideas, and they match how careful human readers judge a page.
Fair treatment of the strong alternatives
If you only compare yourself against weak competitors, or strawman the strong ones, models notice, because they triangulate across everything else they retrieved. A comparison that contradicts the rest of the web gets discounted. Include the alternatives people actually shortlist.
Explicit tradeoffs
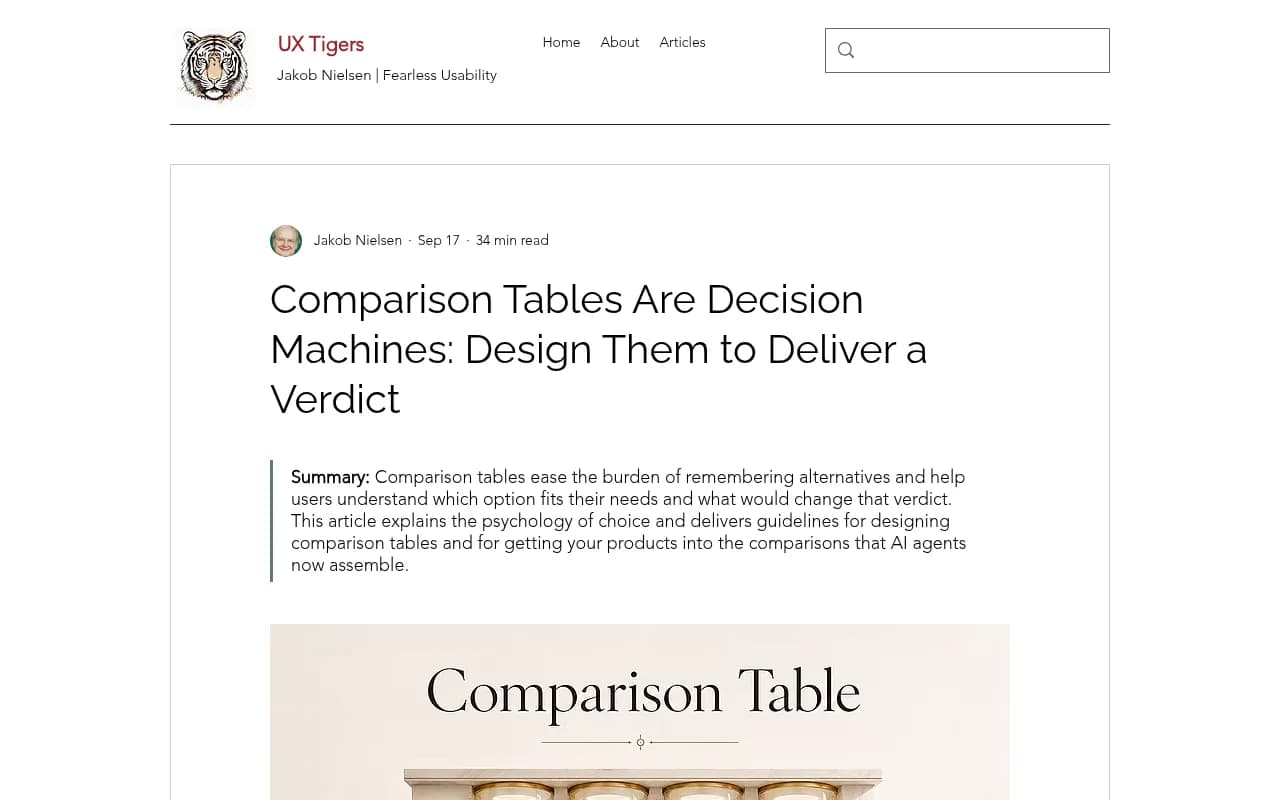
Every product decision costs something. "Faster but uses more memory." "Easier to set up but less customizable." "Great for small teams, thin on enterprise controls." Saying so reads as accuracy. Claiming superiority on every row reads as spin. The UX Tigers piece on comparison tables puts it well: a table that acknowledges a competitor's strength earns belief for every claim it makes elsewhere.
Specific, checkable claims
"Better performance" is nothing. "10,000 requests per second versus their 6,000" is a fact. "More intuitive" is an opinion, while "three setup steps versus seven" can be counted. If a model can check a claim against another source, it will trust it more. If it can't check it, it will probably skip it.
Corroboration
If you say you have a technical edge and independent reviews agree, your credibility goes up. If you say it and nobody else does, trust drops on everything else on the page too.
Designing the table itself
UX Tigers frames a comparison table as a decision machine: alternatives as columns, shared attributes as rows, built so the reader leaves with a verdict. The same structure helps machines. Duda describes tables as databases: categorized entities, attributes and relationships that an algorithm can lift cleanly into an answer.
Rules that hold up
- Use a real HTML or markdown table, not an image and not a grid of divs. Text a crawler can read is text a model can quote.
- One attribute per row, one product per column. Keep units consistent so nobody has to convert.
- Put numbers where numbers exist: price per seat, limits, setup time, supported integrations.
- Leave a few cells that say "No" or "Limited" about yourself. A table with no weaknesses is a flag.
- Add a row for "best for" so the verdict lives inside the table, not only below it.
- Cut rows that don't change a decision. Clutter lowers usability for people and gives models more noise to sift.
- Date the page and state where figures come from.
A before and after
Here is the typical promotional version:
| Feature | Us | Them |
|---|---|---|
| Easy to use | Yes | Yes |
| Powerful reporting | Yes | No |
| Great support | Yes | No |
| Affordable | Yes | No |
Nothing in it can be checked, and nothing is conceded. Compare it to this:
| Attribute | Product A | Product B |
|---|---|---|
| Starting price | $29 per seat per month | $19 per seat per month |
| Setup time | About 1 hour | About 1 day |
| Native integrations | 40 | 120 |
| Custom reporting | Built-in builder | Export to spreadsheet only |
| Free plan | No | Yes, up to 3 users |
| Best for | Teams that need reporting without a data analyst | Small teams on a tight budget |
This one admits that B is cheaper, has more integrations and has a free plan. That's why the reporting claim is believable.
The verdict: a 'when to choose' section
Tables show differences. They don't tell the reader what to do. The format that works best, according to Unusual, is radical clarity about fit: choose us if you need X, choose them if you need Y.
Write it plainly:
- Choose Product A if you need built-in reporting, work in a regulated industry and can spend more per seat.
- Choose Product B if you are under five people, want a free tier, and rely on a long list of integrations.
- Choose neither if your main need is Z. Name a third option if you honestly know one.
That last line feels risky. It also tends to be what separates a page people trust from a landing page with extra steps.
A page structure you can copy
- A two- or three-sentence summary at the top stating who each option suits. Models and impatient readers both pull from here.
- The comparison table, immediately after.
- A short section per row that matters: what the difference is, with evidence, and a link to docs or pricing.
- Where each product is weaker. Write this section for yourself first, and be harsher than you'd like.
- The 'when to choose' verdict.
- A short FAQ using the questions people actually ask ("Is A cheaper than B?", "Does B integrate with X?").
- A last-updated date and a note on how you tested or sourced the claims.
The point from the research on formatting is that models like pages where the answer and its evidence sit close together. Don't make a claim in paragraph two and prove it in paragraph nine.
Which comparison pages to write
Start with the rivals you are most often compared with. Promptwatch's unique-domains report recommends publishing comparison pages for exactly those competitors, and it makes a second point that is easy to miss: find the third-party comparison and review pages ChatGPT cites for your category and make sure they describe you accurately. You can't control those pages, but you can send corrections, supply current specs and publish clear facts they can quote.
If you skip the 'You vs. Rival' page, the UX Tigers article warns, the AI assembles its table from sources that did write one, and your competitor's framing becomes the robot's framing.
Also look at your product pages. The same Promptwatch report advises making them easy to compare, with clear pricing, specs and who each plan is for. Product and landing pages together are about 39% of ChatGPT citations, so a comparison page that links to a vague product page undercuts itself.
Keep it current
Because comparison pages stay cited for a long time (63% still cited at day 60 in the half-life data), stale numbers do damage for a long time too. Product pages in the same study had a half-life of 74 to 77 days, so pricing and spec changes should trigger a review. A realistic routine:
- Check prices, limits and plan names monthly.
- Re-read competitor changelogs quarterly and fix any row that moved.
- Show a visible updated date and change it only when you actually changed something.
Tools that help
You don't need a stack to write an honest page, but a few tools make the loop easier.
To see which prompts trigger comparisons in your category, which third-party pages get cited next to you, and whether your new page gets crawled and cited, an AI visibility platform helps. Promptwatch tracks the real interfaces of ChatGPT, AI Overviews, Perplexity and others, shows citations per page, and logs AI crawler visits so you can tell whether a model ever read your table.
For fact-checking competitor claims and spotting changes on their pricing pages, competitive intelligence tools are useful. Crayon and Klue track competitor changes, and PageCrawl.io watches individual pages for edits.

Schema markup can make entities and attributes easier to parse. I haven't verified how much it changes citation behavior, so treat it as a low-risk extra rather than a fix. Schema App is one option for managing it.
For a wider view of options, the GEO software directory at bestgeosoftware.com lists tools by category.
Quick comparison of what each tool type does here
| Job | Tool type | Examples |
|---|---|---|
| See which comparison prompts cite you or rivals | AI visibility platform | Promptwatch, Profound |
| Watch competitor pricing and feature changes | Competitive intelligence | Crayon, Klue |
| Monitor specific URLs for edits | Page change monitoring | PageCrawl.io |
| Add structured data | Schema management | Schema App |
| Check your own rankings and queries | Search analytics | Google Search Console |
Common mistakes
- Weighting rows to fit your strengths and calling the rest 'nice to have'.
- Comparing only against the weakest competitor in the category.
- Vague adjectives where a number or a count was possible.
- Hiding the table inside an image or an interactive widget crawlers can't read.
- Publishing once and never touching the page again.
- Writing the verdict as 'choose us' for every reader type.
How to check whether it worked
After publishing, look at three things. First, whether AI crawlers fetched the page at all. Second, whether it appears among the sources for the comparison prompts you care about, such as "[your brand] vs [rival]". Third, whether the AI's summary of the differences matches what you wrote, including the tradeoffs. If the model repeats a competitor's framing instead, look at the third-party pages it cites and fix the facts there.
Give it weeks, not days. Consistent, honest comparisons build a reputation as a reliable source over time, which is the whole bet.
Bottom line
The format is simple: a real table, numbers that can be checked, a few admitted weaknesses and a clear verdict about who should pick what. Comparison pages won't be your largest citation source, but for commercial prompts they punch above their weight and they stay cited longer than most content. Write the one you would trust if you were the buyer.