Key takeaways
- Google's AI shopping surfaces behave differently from classic Shopping ads, so Share of Voice in product listing ads alone no longer tells you who is winning.
- Benchmark by intent. Commercial, informational and branded prompts each pull a different mix of page types, so track them as separate prompt sets.
- Measure five things per competitor: presence, position, product data quality, source mix and price/promotion signals.
- Feed quality and clean Product schema are the inputs you control most directly. Competitor tracking tells you where to apply them.
- Run the benchmark on a fixed cadence (weekly for volatile categories, monthly for stable ones) and log changes, because AI surfaces get retuned without warning.
Why classic Shopping benchmarking is no longer enough
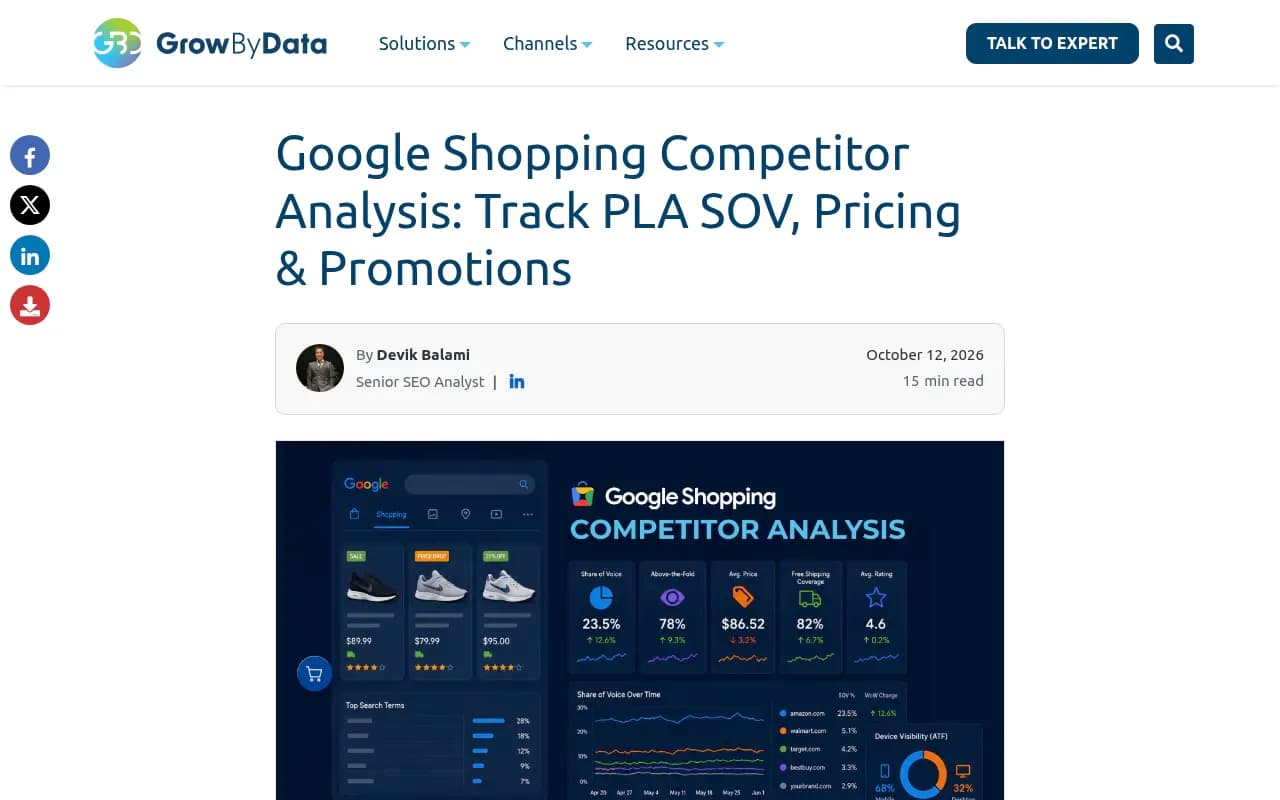
For years, competitor analysis in Google Shopping meant one thing: watch the product listing ad auction. You pulled auction insights, estimated impression share, and checked rivals' prices, sale badges and free-shipping annotations. A Google Shopping competitor analysis still starts there, tracking Share of Voice, product-level pricing and promotional annotations on rivals.
That work is still valid. But shoppers now ask Google's AI surfaces to brainstorm, compare and shortlist before they ever see an ad grid. Google's own Think with Google hub frames it bluntly in a holiday piece titled "Holiday shoppers use AI to brainstorm. Will it name your brand?" That question is the one a modern benchmark has to answer.
A caveat before going further. Much of the detailed Google material on AI shopping is gated or still evolving, and the specifics of how AI Mode picks products are not fully documented publicly. So this guide is a framework, not a claim about Google's ranking logic. You observe, record and compare. You do not assume.
What counts as a Google AI shopping surface
For benchmarking purposes, I split Google's surfaces into four buckets:
- Classic Shopping results and PLAs, the paid and free listings you already track.
- AI Overviews on shopping-adjacent queries, which cite sources and sometimes surface products.
- AI Mode conversations, where a shopper refines a request over several turns.
- Agentic features, such as AI-assisted checkout flows, which Shopify's overview of Google's AI shopping features covers from a merchant's point of view.
Each bucket has a different unit of competition. In PLAs it is an impression. In AI Overviews it is a citation or a mention. In AI Mode it is whether your product appears in the recommended set at all. Mixing these into one number hides the story, so keep them separate in your sheet.
The benchmarking framework
The framework has five steps: define the competitive set, build prompt sets by intent, capture observations, score them, and act.
Step 1: define your competitive set
Start with the competitors you already know, then add the ones AI surfaces actually show. They are often different. Marketplaces and comparison sites frequently crowd out brands. Promptwatch Data found that for automotive prompts in August 2026, marketplaces like Autotrader and Cars.com outranked every car brand in ChatGPT citations. The same pattern shows up in other categories: your real rival for a slot may be a retailer or aggregator, not the brand you benchmark against in board decks.
Keep three lists:
- Direct brand competitors
- Retailers and marketplaces that carry both of you
- Editorial or comparison sources that shape the shortlist
Step 2: build prompt sets by intent
This is the step most teams skip and the one that matters most. Promptwatch's content type research (ChatGPT, Sep 28 to Oct 4, 2026) shows why. Across all citations, product pages were the top type at 22.4%, ahead of landing pages (16.8%) and listicles (13.6%). But the mix shifts by intent:
| Prompt intent | Product pages | Landing pages | Listicles | Other notable types |
|---|---|---|---|---|
| Commercial | 26.0% | 20.6% | 15.0% | Comparisons 7.9% |
| Informational | 19.1% | 13.9% | 13.6% | How-tos 10.7%, docs 8.5% |
| Branded | 23.3% | 22.8% | n/a | Reviews 5.6%, FAQ 4.8%, social 3.0% |
That data is from ChatGPT, not Google, and I would not treat the percentages as Google numbers. What transfers is the method: each intent pulls different content, so a single blended prompt list will average away the signal. Build three sets:
- Commercial: "best running shoes for flat feet", "best espresso machine under $500"
- Informational: "how to choose a standing desk", "what is a good thread count"
- Branded: "[Competitor] vs [You]", "is [Competitor] worth it", "[Competitor] reviews"
Aim for 20 to 50 prompts per set to start. Write them the way buyers talk, including follow-ups, because AI Mode is conversational. A second-turn prompt like "which of those is best for small kitchens" often reshuffles the product set.
Step 3: capture observations
For every prompt, on every surface, record:
- Whether product cards, carousels or recommendations appeared
- Which products and brands were shown, in order
- Which sources were cited next to the answer
- Price, availability and promotion text displayed
- Country, language, device and date
Location and device matter. Shopping results vary by market, and an answer in one country may look nothing like another. Fix your test conditions and keep them the same each run.
Also record the absence of shopping features. Promptwatch's ChatGPT shopping report found that product cards attach to only a low single-digit percentage of web-search responses overall, concentrated in commercial and transactional prompts, and that the rate moved in visible steps, roughly doubling overnight in late May before falling back. Promptwatch reads that as the platform tuning when cards appear. Google's surfaces are likely to behave similarly, so a sudden change in your numbers may be a platform change and not anything you or a competitor did. Log the date of every shift.
Step 4: score what you captured
A simple scorecard works better than a clever one. Per competitor, per intent set, per surface:
| Metric | What it tells you | How to compute |
|---|---|---|
| Presence rate | Coverage | Prompts where the product or brand appears / total prompts |
| Average position | Prominence | Mean rank among displayed products or sources |
| Share of voice | Relative strength | Your appearances / all tracked-brand appearances |
| Source mix | Where you win from | Share of appearances by cited page type and domain |
| Data quality delta | Why you win or lose | Price, availability, reviews, schema and image completeness vs rivals |
| Promo signal | Price pressure | Sale badges, discounts, shipping claims shown |
Read the metrics together. Low presence is a coverage problem: you are not in the consideration set. Good presence but late position is a prominence problem. Appearances that never cite your own pages point at content or crawlability, not at the product itself.
Step 5: turn gaps into fixes
Benchmarks are useless if nothing changes after them. Map each gap to a fix:
- Missing from commercial prompts: check feed completeness, Product schema, and whether your product pages are easy to compare (clear price, specs, target buyer).
- Present but trailing a rival: compare their page and feed against yours field by field. Look at reviews, images, shipping and return details.
- Rivals appear through roundups: pursue inclusion in the listicles and comparison pages that get cited, and publish your own comparison pages.
- Branded prompts return reviews or forums that hurt you: fix the underlying product or reputation issue, and give AI a stronger first-party page to cite.
Google-side hygiene still pays off here. Guides like Vizion's 2026 Google Shopping guide and Scube's 2026 Google Shopping statistics both emphasize feed quality as a driver of campaign performance, and the same data feeds the surfaces you are now benchmarking.
Tools for each layer of the benchmark
No single product covers every layer, so most teams combine three kinds of tool.
Layer 1: classic Shopping and price intelligence
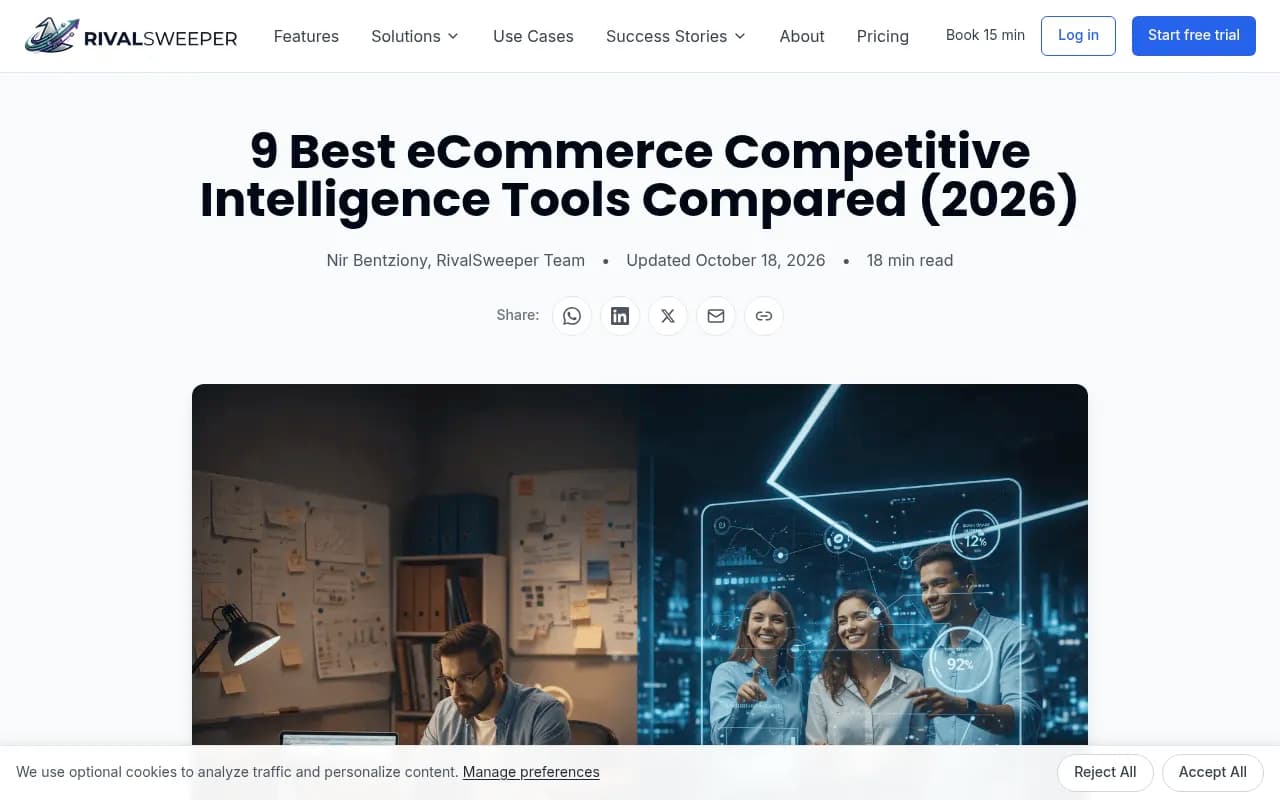
These track PLA share, prices and catalog changes. Dedicated ecommerce competitive intelligence platforms monitor competitor catalogs for new arrivals, discontinued items and assortment shifts, and price-only trackers are cheaper but narrower. RivalSweeper's comparison of ecommerce competitive intelligence tools is a useful read, though note that RivalSweeper publishes it and is one of the tools compared, so weigh the rankings accordingly.
For broader competitive tracking, from the catalog:
Crayon and Klue lean toward B2B sales battlecards, so they suit software sellers more than consumer retailers. Similarweb is better for traffic-level context on rival sites.
PageCrawl.io is handy for the unglamorous job of watching specific competitor product pages for price and content changes.
Layer 2: AI answer and citation tracking
This is where you see which brands, products and sources AI surfaces name. Promptwatch tracks real user interfaces across ChatGPT, Google AI Overviews, Google AI Mode, Gemini, Perplexity and others, and includes AI Shopping tracking for product visibility in ChatGPT shopping carousels, with prompt volumes and difficulty scores to help you prioritize which prompts to benchmark first.
Other options for answer-level monitoring include:
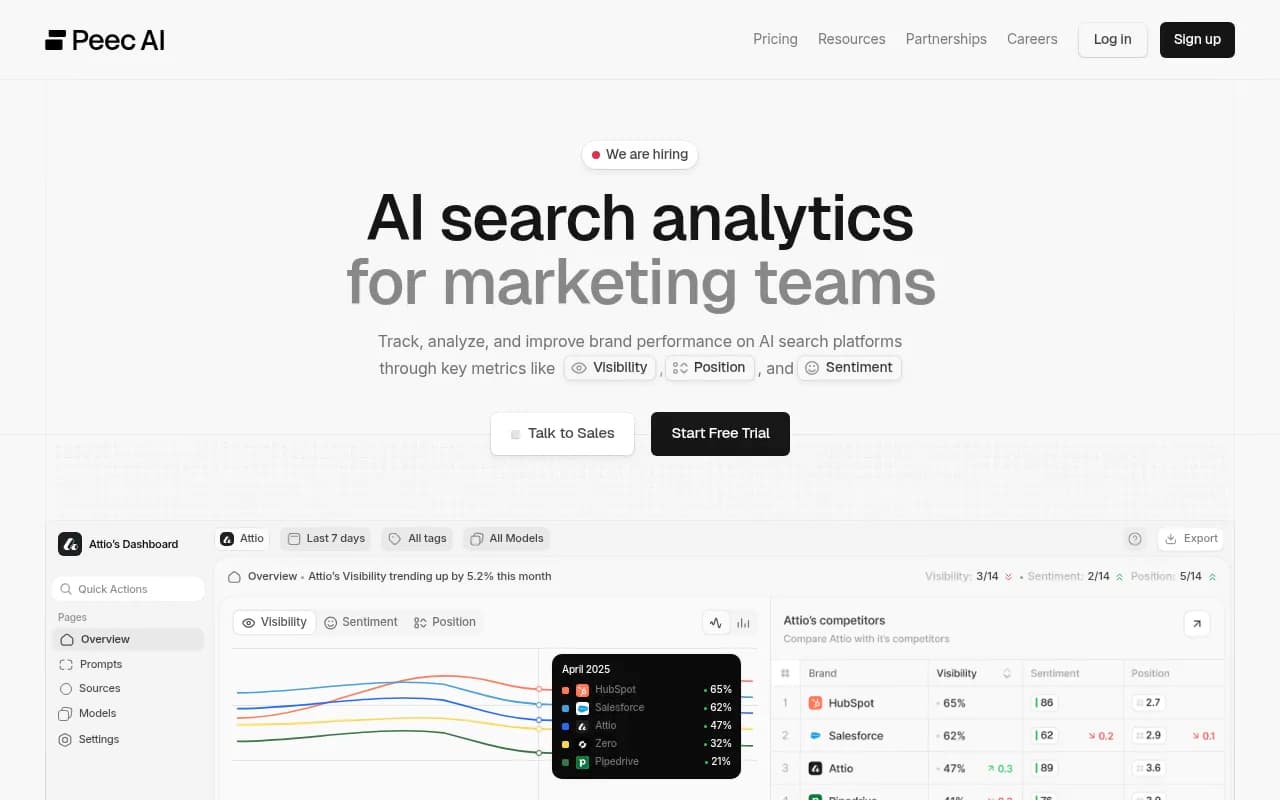
Treat these as monitoring layers. They tell you who appears. Whether they also help you fix the gap is a separate question to ask in a demo. For more options, the directories at bestgeosoftware.com and ai-rank-tools.com list a wide range of GEO and AI rank tracking products.
If you want a Google-specific starting point, Meltwater's roundup of Google AI Overview tracking tools compares options for monitoring citations and brand presence in AI Overviews.
Layer 3: your own first-party data
Google Search Console and Merchant Center diagnostics are free and tell you what Google already knows about your products.
Schema App is relevant when structured data is the bottleneck, since complete Product markup is one of the more controllable inputs.
Tool comparison at a glance
| Layer | Question it answers | Example tools | Watch out for |
|---|---|---|---|
| Price and catalog | What are rivals charging and launching? | RivalSweeper, Prisync, PageCrawl.io | Narrow: says nothing about AI answers |
| Market intelligence | How big is their traffic and where from? | Similarweb, Crayon | Estimates, and some tools skew B2B |
| AI answer tracking | Who gets named and cited? | Promptwatch, Profound, Otterly.AI, Peec AI | Monitoring-only tools leave the fix to you |
| First-party data | What does Google see on my site? | Search Console, Schema App | Shows your data, not rivals' |
Cadence and hygiene
A few rules that keep the benchmark honest:
- Freeze your prompt sets for at least a quarter. Changing prompts mid-stream makes trends meaningless. Add new prompts as a separate cohort.
- Run on a fixed schedule. Weekly for fast categories like electronics or seasonal gifts, monthly for stable ones. Before Q4, tighten the cadence. Think with Google's October 2026 special report on post-holiday shopping suggests the window after the season matters too, so don't stop tracking on December 26.
- Annotate every change. Feed update, price cut, new competitor launch, Google announcement. When a number jumps, the annotation is how you know why.
- Sample more than once. AI answers vary between runs. Repeat each prompt a few times and use the rate, not a single observation.
- Keep a screenshot archive. A saved image of what a shopper saw beats a spreadsheet cell when you need to convince a stakeholder.
- Look at AI crawlers too. If AI systems cannot fetch your product pages cleanly, no amount of feed work will help. Server logs or an AI crawler log tool show whether bots reach your pages and hit errors.
A worked example
Say you sell mid-range espresso machines and your top rival is a brand with a stronger review base.
You build 30 commercial prompts, 20 informational and 20 branded. On the first run you find you appear in 18% of commercial prompts versus 41% for the rival, and a large retailer shows up in more than half of them. Your average position when you do appear is third.
Digging into the source mix, the rival's wins mostly cite two listicles and a comparison page you are not in. Your product pages lack complete Product schema, and your feed omits shipping time. Branded prompts show your reviews are thinner and your first-party FAQ is nonexistent.
The action list writes itself: fix the schema and the feed fields, pitch the two listicles, publish a "[You] vs [Rival]" comparison page, and build an FAQ page for branded questions. Rerun in four weeks against the same prompts. If presence rises on the prompts you targeted and not elsewhere, you have good evidence the fixes worked.
Common mistakes
- Treating ChatGPT data as Google data. The behaviors rhyme, but they are different systems. Promptwatch Data also shows how much citation behavior differs by model: in the week of Sep 28 to Oct 4, 2026, ChatGPT drew 0.46% of its citations from social platforms while Google AI Overviews drew 12.2%. Benchmark each surface on its own.
- Tracking only your own products. The point is relative position.
- Ignoring retailers. They are often the real competition for the slot.
- Chasing a single blended score. Keep intent and surface separate until you know where the problem lives.
- Skipping price and promo data. AI answers frequently surface price comparisons, so a stale feed hurts you twice.
Where to go from here
Start small. Pick one product category, three competitors, 30 prompts split by intent, and run it by hand once to learn what your surfaces actually show. Then decide what to automate. If you want broader context on citation behavior across models, the Promptwatch Data hub publishes regularly updated research, and the Google AI Overview citation share report for June 2026 and its AI Mode counterpart show which domains Google's AI surfaces cite most.
The benchmark will be imperfect. Google's AI shopping surfaces keep changing, and some of the detail is simply not public yet. But a repeatable, intent-split, well-annotated scorecard beats guessing, and it gives you something concrete to improve against every month.