Key takeaways
- AI search engines (ChatGPT, Perplexity, Google AI Mode) decompose a single user query into 8-12 parallel sub-queries before generating an answer -- most brands only appear in a fraction of those.
- 95% of fan-out sub-queries show zero monthly search volume in traditional keyword tools, which means standard SEO reporting completely misses the problem.
- A Fan-Out Visibility Gap Report translates this technical reality into a stakeholder-friendly format: coverage scores, gap maps, and prioritized content opportunities.
- The report works best when it connects query tree coverage directly to revenue risk -- not just rankings or impressions.
- Tools like Promptwatch can surface fan-out data, map gaps against competitor coverage, and generate content briefs to close them.
Why your current reporting misses most of your AI visibility problem
Here's the uncomfortable truth about most brand visibility reports in 2026: they're measuring the wrong thing.
Traditional SEO dashboards track rankings for target keywords. Maybe you've added some share-of-voice metrics, a few brand mention counts, or an AI Overview appearance rate. That's a start. But it misses the structural shift that's been quietly reshaping how AI search engines work.
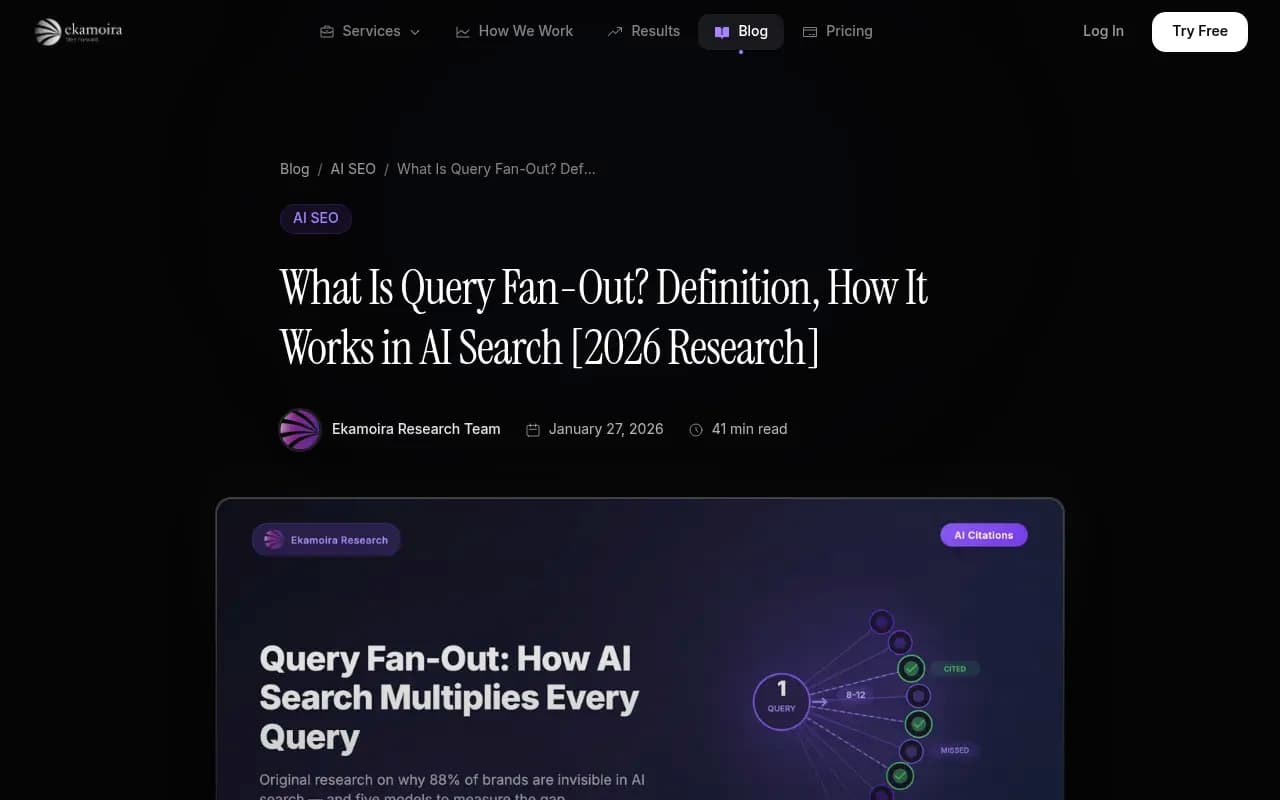
When someone types "best project management software for remote teams" into ChatGPT or Google AI Mode, the model doesn't look up that phrase. It fires a cluster of parallel sub-queries -- something like "top project management tools 2026," "remote collaboration features comparison," "project management pricing tiers," "PM software pros and cons," "Reddit recommendations project management" -- and synthesizes the results into one answer. This is query fan-out.
A December 2025 Surfer SEO study analyzing 173,902 URLs across 10,000 keywords found that 68% of pages cited in AI Overviews were not in the top 10 organic results. Your traditional rank tracker would show those pages as invisible. The AI was citing them constantly.
The inverse is also true. You might rank #1 for your target keyword and still get zero citations in AI responses, because the model's sub-queries are hitting angles your content doesn't cover.
That's the gap this report is designed to expose.
What query fan-out actually looks like
Before you can build the report, you need to understand the structure you're mapping.
Take a prompt like "what CRM should a B2B SaaS company use?" An AI search engine doesn't retrieve one answer. It simultaneously runs sub-queries across several dimensions:
- Feature comparisons ("CRM features for B2B SaaS")
- Pricing signals ("CRM pricing enterprise vs startup")
- Social proof ("CRM recommendations Reddit 2026")
- Risk signals ("CRM complaints limitations")
- Recency checks ("best CRM 2025 2026")
- Use-case specifics ("CRM for sales-led growth")
Each sub-query is a separate retrieval event. Your brand needs to appear in enough of them to make the final synthesized answer. Miss three or four, and you're filtered out -- not because your product is worse, but because the AI couldn't confirm you from enough angles.
Research from 85sixty analyzing 72,000+ AI-generated queries found that 95% of fan-out phrases show zero monthly search volume. That's why keyword tools don't catch this. The sub-queries are real retrieval events with real consequences, but they're invisible to traditional measurement.
The fan-out also varies by industry. Queries with high purchase stakes (software, financial products, healthcare) tend to generate more sub-queries, because the model is doing more due diligence before committing to a recommendation. Low-stakes queries fan out less. This matters for how you prioritize your gap analysis.
Building the Fan-Out Visibility Gap Report
The report has four components: the query tree map, the coverage audit, the gap analysis, and the stakeholder-ready summary. Each builds on the last.
Component 1: The query tree map
Start by selecting 5-10 core prompts that represent how your target customers actually ask about your category. These aren't keywords -- they're full natural-language questions.
For each prompt, map the likely sub-query tree. You can do this manually by running the prompt in ChatGPT, Perplexity, and Google AI Mode and observing what sources get cited, then reverse-engineering what sub-queries would have retrieved those sources. Or you can use a platform that surfaces fan-out data directly.
Promptwatch has a query fan-out feature that shows how a single prompt branches into sub-queries, along with volume estimates and difficulty scores for each branch. That's the kind of data that makes this component much faster to build.
For each core prompt, your tree should show:
- The root prompt
- 6-12 sub-queries the AI likely fires
- The intent type of each sub-query (comparison, review, pricing, recency, risk, use-case)
- Which sub-queries your brand currently appears in
Component 2: The coverage audit
Now score your current coverage. For each sub-query in the tree, check whether your brand appears in the AI response. This is binary at first -- cited or not cited -- but you can add nuance by noting whether you appear as a primary recommendation, a secondary mention, or not at all.
A simple coverage score: (sub-queries where brand appears) / (total sub-queries in tree) x 100.
A brand appearing in 3 of 10 sub-queries has 30% fan-out coverage for that prompt. That number is immediately legible to a non-technical stakeholder. It's also alarming enough to get budget approved.
Run this across all your core prompts and average the scores. Most brands, when they do this honestly for the first time, land somewhere between 20-40% coverage. That's the real story your current reporting isn't telling.
Component 3: The gap analysis
Coverage scores tell you where you're missing. The gap analysis tells you what to do about it.
For each uncovered sub-query, identify:
- What type of content would satisfy it (comparison page, review roundup, pricing page, FAQ, Reddit-style discussion)
- Whether you have existing content that could be optimized to cover it
- Whether a competitor is currently appearing there (and what their content looks like)
This is where the report gets actionable. A gap isn't just "we don't appear here." It's "we don't appear here, competitor X does, and here's the content type that would fix it."
Group gaps by type. You'll often find patterns -- maybe you're consistently missing on "pricing" sub-queries because your pricing page is thin, or on "risk/limitations" sub-queries because you have no content that honestly addresses tradeoffs. Those patterns are strategic insights, not just data points.
Tools that help with this component:
Component 4: The stakeholder-ready summary
This is where most technical reports fall apart. The data is solid but the presentation loses the room.
Stakeholders don't need to understand query fan-out. They need to understand the business risk of not fixing it. Frame the summary around three things:
Revenue exposure: If your brand is invisible in 70% of the sub-queries for "best [your category] software," what percentage of AI-referred purchase decisions are you missing? Connect this to traffic data if you have it -- tools like Promptwatch can show AI traffic attribution, so you can estimate what improved coverage would mean in actual visits and conversions.
Competitive position: Show where competitors are appearing that you're not. A heatmap format works well here -- prompts on one axis, competitors on the other, with color coding for who appears where. This is viscerally legible to any executive.
The fix: Don't end the report with problems. End with a prioritized list of content gaps to close, ranked by estimated impact. Three to five specific content pieces that would meaningfully improve coverage is more useful than a 40-item backlog.
Metrics to include in the report
Here's a reference table for the metrics that belong in a Fan-Out Visibility Gap Report, what they measure, and how to get them:
| Metric | What it measures | How to get it |
|---|---|---|
| Fan-out coverage score | % of sub-queries where brand appears | Manual audit or GEO platform |
| Prompt-level citation rate | How often brand is cited per root prompt | GEO tracking tools |
| Competitor coverage delta | Your coverage vs top competitor per prompt | Competitor heatmap |
| Sub-query gap count | Number of uncovered sub-queries | Fan-out audit |
| Gap type distribution | Mix of comparison/pricing/review/risk gaps | Manual categorization |
| Content coverage ratio | % of gaps with existing content to optimize | Content audit |
| AI traffic attribution | Visits/conversions from AI-referred sessions | Platform analytics |
| Citation velocity | Rate of new citations after publishing content | Page-level tracking |
Not all of these are easy to get without dedicated tooling. The first three can be assembled manually with patience. The last two really require a platform that connects crawler data to traffic attribution.
Presenting the report to different stakeholders
The same data needs different framing depending on who's in the room.
For the CMO or VP of Marketing
Lead with the competitive gap. Show the heatmap. Make the point that AI search is now a meaningful traffic channel (DataReportal puts active generative AI users at over 2 billion in 2026), and that your brand's coverage is currently X% while your top competitor sits at Y%. That's the hook. Then show the investment required to close the gap.
Avoid technical language. "Query fan-out" can stay in the appendix. The slide they'll remember is the one that shows your brand appearing in 3 out of 10 AI responses while a competitor appears in 8.
For the SEO or content team
They need the full gap analysis. Walk through the query trees, the sub-query types you're missing, and the content recommendations. Be specific about format -- a thin FAQ page won't fix a "risk/limitations" gap; you need substantive content that actually addresses tradeoffs. Show them examples of competitor content that's currently winning those sub-queries.
For the CFO or finance team
Connect coverage to revenue. If AI-referred sessions have a conversion rate similar to organic search (often higher, because AI recommendations carry implicit endorsement), then closing a 40-point coverage gap has a calculable revenue impact. You don't need precise numbers -- a conservative range is enough to justify the content investment.
Tools that support fan-out visibility measurement
A few platforms have built features specifically for this type of analysis. Here's how they compare on the dimensions that matter for building this report:
| Tool | Fan-out tracking | Competitor heatmap | Content gap analysis | AI traffic attribution |
|---|---|---|---|---|
| Promptwatch | Yes (query fan-outs) | Yes | Yes (Content Agents) | Yes |
| Conductor | Partial | Yes | Partial | No |
| Semrush Enterprise | Yes (new feature) | Partial | Partial | No |
| Otterly.AI | No | No | No | No |
| Profound | Partial | Yes | No | No |
| AirOps | No | No | Yes | No |
Promptwatch is the only platform in this list that connects all four capabilities into one workflow -- which matters when you're trying to go from gap identification to content creation to tracking the results. Most of the others do one or two pieces well.
Common mistakes when building this report
A few things that consistently undermine otherwise solid fan-out reports:
Auditing too many prompts at once. Start with 5-10 core prompts that represent high-intent, high-value queries. A 50-prompt audit is impressive but overwhelming. Stakeholders want to see the problem clearly, not drown in data.
Treating all sub-queries as equal. A "pricing" sub-query for a $50K enterprise software purchase carries more weight than a "what is" informational sub-query. Weight your coverage scores by sub-query intent and commercial value.
Reporting coverage without context. A 35% coverage score means nothing without a benchmark. Show competitor scores. Show industry averages if you have them. Context is what makes the number actionable.
Skipping the content recommendation. A gap report without a content plan is just a list of problems. Every gap should have a corresponding content recommendation -- even a rough one. "We need a 1,500-word comparison page addressing [topic]" is enough to move forward.
Updating too infrequently. Fan-out behavior shifts. AI models update. Competitors publish new content. A quarterly update cadence is the minimum; monthly is better for fast-moving categories.
Turning the report into an ongoing program
The Fan-Out Visibility Gap Report shouldn't be a one-time deliverable. The brands that consistently win in AI search treat it as a recurring measurement cycle:
- Map the query trees for your highest-value prompts
- Audit coverage and score the gaps
- Prioritize gaps by revenue impact and content effort
- Publish content targeting the highest-priority gaps
- Track citation velocity -- how quickly AI models start citing the new content
- Update the report and repeat
This is essentially the same loop that made content marketing work in traditional SEO, but calibrated for AI retrieval behavior instead of keyword rankings. The difference is that the feedback loop is faster. A well-structured piece of content can start appearing in AI citations within days of being crawled, not months.
Platforms like Promptwatch have built this cycle into their product -- the Answer Gap Analysis finds the gaps, Content Agents generate the briefs and articles, and page-level tracking shows when new content starts getting cited. That's the kind of infrastructure that makes the program sustainable rather than a quarterly scramble.
A note on what fan-out data can't tell you
Query fan-out analysis is genuinely useful, but it has limits worth acknowledging.
The sub-queries AI models fire are inferred, not directly observable in most cases. Platforms that surface fan-out data are making educated inferences based on citation patterns, source analysis, and model behavior -- not reading the model's internal retrieval log. That means the query trees you build are approximations, not ground truth.
This doesn't make the analysis less valuable. Approximations that are directionally correct are enough to prioritize content investments. But it's worth being honest with stakeholders about the methodology, especially if they push for precision.
The other limit: fan-out behavior varies by model and by day. Research shows that 73% of fan-out queries change with every search. A coverage score is a snapshot, not a permanent state. That's an argument for monitoring continuously, not for abandoning the measurement.
What good coverage actually looks like
To give you a concrete target: brands that consistently appear in AI recommendations for competitive queries tend to have 60-80% fan-out coverage across their core prompt set. Getting from 25% to 60% is a realistic 6-12 month content program for most teams. Getting from 60% to 80% is harder and requires more sophisticated content -- the kind that addresses nuanced sub-queries around risk, limitations, and specific use cases that most brands avoid writing.
The brands that hit 80%+ aren't just producing more content. They're producing content that specifically addresses the angles AI models use to cross-check recommendations: honest comparisons, pricing transparency, limitation acknowledgments, and third-party validation signals (reviews, Reddit mentions, expert citations).
That's the strategic insight buried inside the Fan-Out Visibility Gap Report. It's not just a measurement tool. It's a map of the content your brand needs to exist in AI search.