Key takeaways
- A quarterly AI visibility report works best when you pull the whole quarter in a single API request, then let Looker Studio handle slicing by engine, topic, and week.
- Pick a tool whose API date window covers 90 days or more. Promptwatch's REST API v2 allows ranges up to 92 days, so a full quarter fits in one call.
- Segment citation metrics by AI engine. ChatGPT cites about 5 sources per answer, Google AI Overviews and Perplexity about 10, so a blended number misleads.
- Annotate step changes (model updates, citation shifts) and compare quarter over quarter instead of assuming stability.
- The "one request" idea is a design goal, not a universal feature. Check your vendor's API docs for the date range limit before you commit.
Why a quarterly report, and why an API
Weekly AI visibility numbers wobble. Prompts get answered differently from one day to the next, models are updated without notice, and a single bad week can send a dashboard into a panic. A quarterly view smooths that noise and matches how leadership already reads marketing results: quarter against quarter, next to traffic and revenue.
The usual way to build one is to export CSVs every month and paste them into a spreadsheet. It works until the third quarter, when someone forgets, the column order changes, and nobody trusts the numbers. An API fixes that. The data arrives the same shape every time, and Looker Studio refreshes it without anyone touching a file.
One caveat before we go further. I could not find any vendor documentation promising a single call that returns "the quarterly report." What does exist is simpler and more useful: APIs that accept a date range wide enough to cover a quarter, so one request returns the whole period. Whether that works depends on the tool's limit, so check it first.
What the pipeline looks like
There are three ways to get AI visibility data into Looker Studio, and they differ in effort and flexibility.
- A native or community connector. You install it, paste an API key, pick a project, and you are done in minutes.
- A REST API call through a connector you control. Google Apps Script community connectors can call any JSON API, and Looker Studio treats the result like any other data source.
- A scheduled export to a warehouse or Google Sheets, with Looker Studio reading from there. More plumbing, but you can blend in GA4, ad spend, and CRM data cleanly.
Note that Google has been rebranding Looker Studio as "Data Studio" in some places. LLM Pulse's own page uses "Data Studio (formerly Looker Studio)", so check what your account shows before you write the name into a client deliverable.
Option 1: use a ready-made connector
LLM Pulse publishes a free template and a free community connector. Setup is four steps: open the template, click "Make a copy" or "Use my own data", install the connector, then paste your API key, pick the project, tick metrics and competitors, and click Connect. They say it takes about five minutes and needs no code. The template, connector, and Looker Studio itself are free, but you still need an LLM Pulse subscription with API access to fill it.
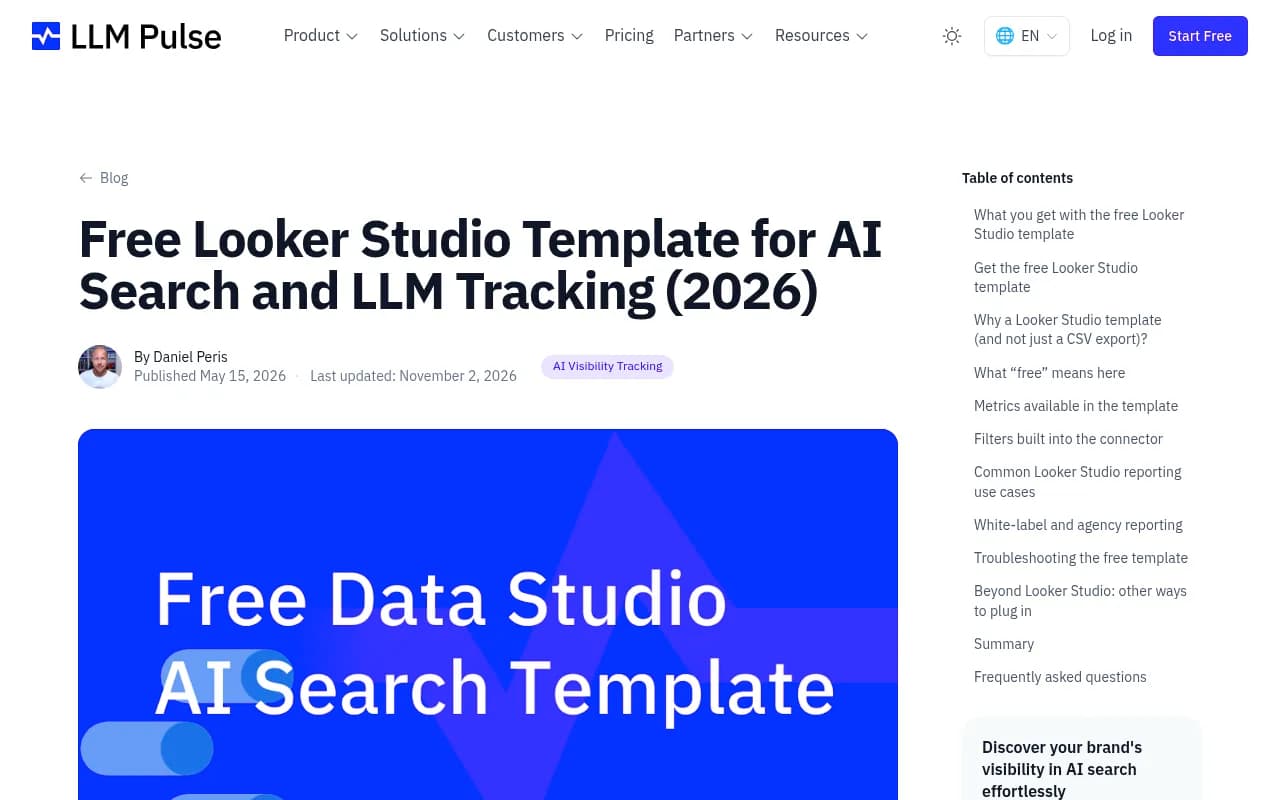
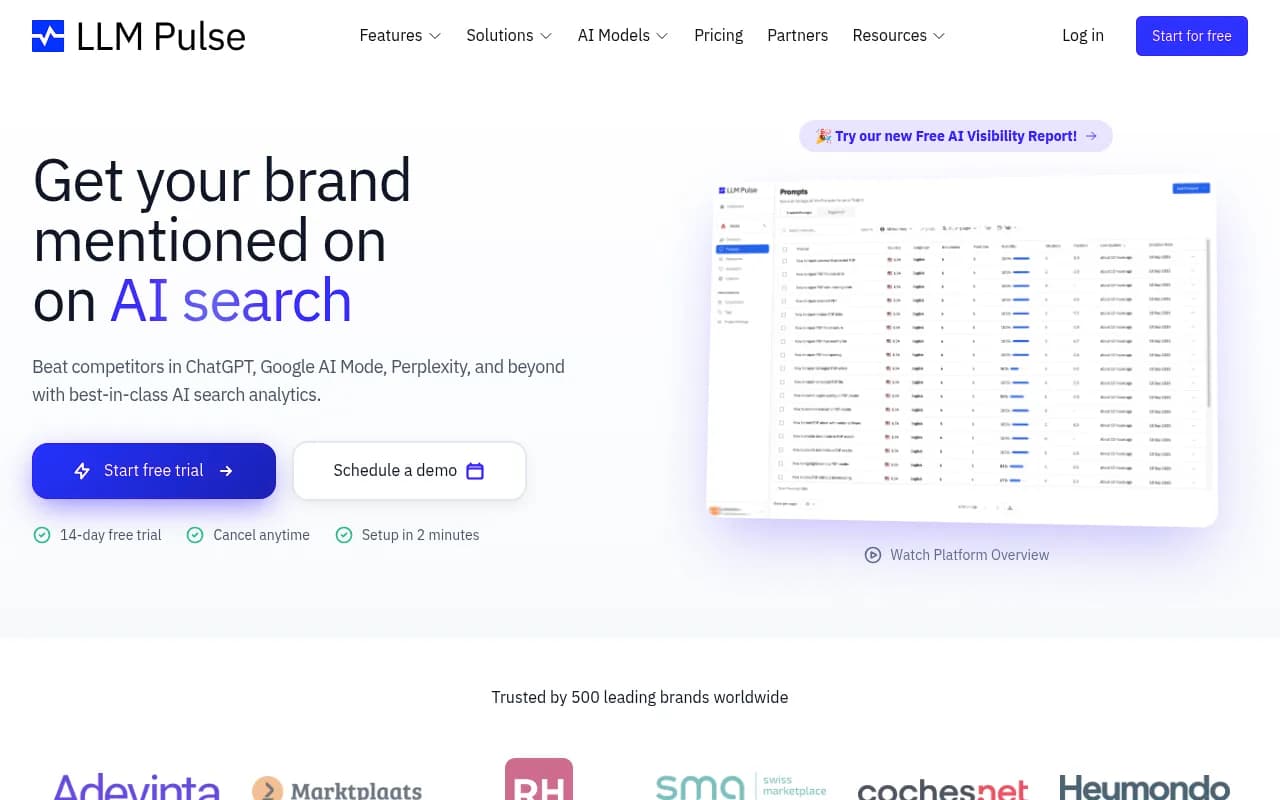
Its template covers a position-weighted visibility score, mention rate, citation rate, average position, share of voice against competitors, a five-bucket sentiment breakdown with a net score from -100 to +100, and per-model splits. Date presets are 7, 30, 90, or 180 days, with daily, weekly, or monthly granularity. The 90-day preset is exactly what a quarterly report needs.
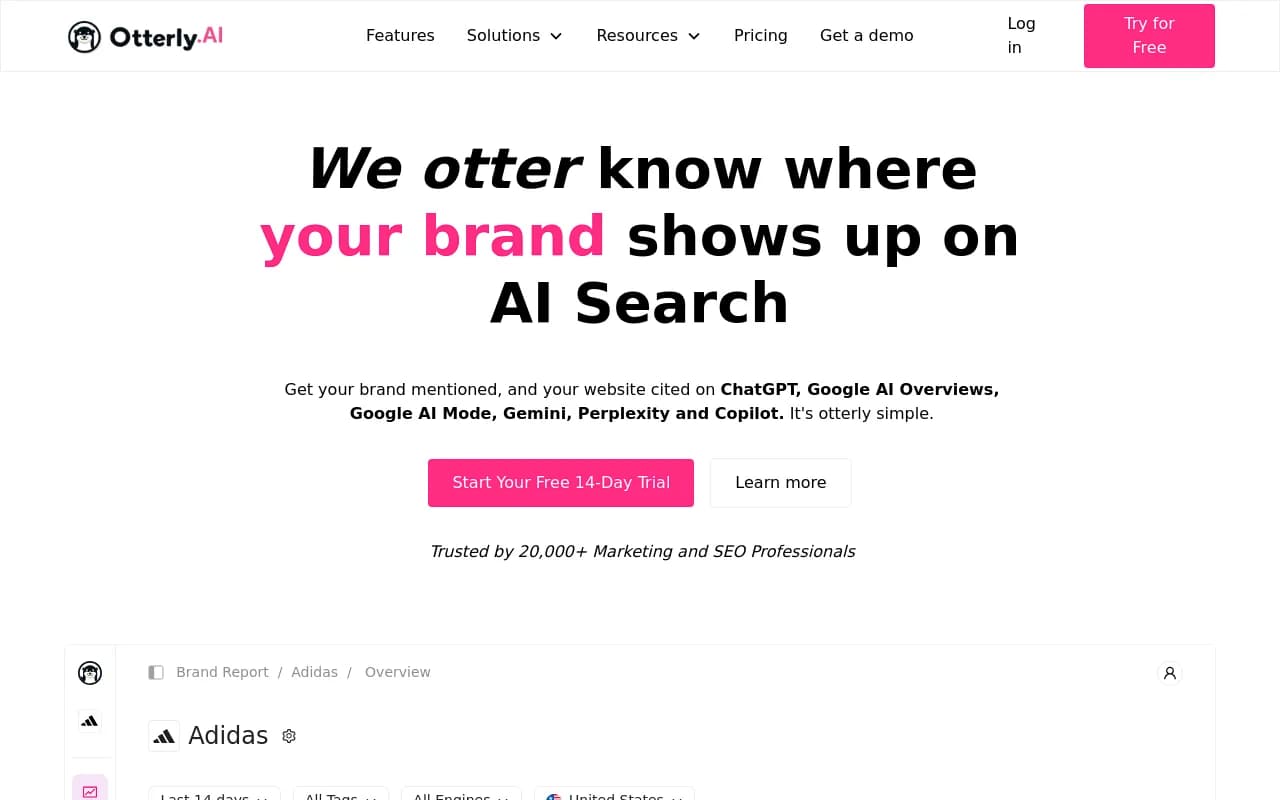
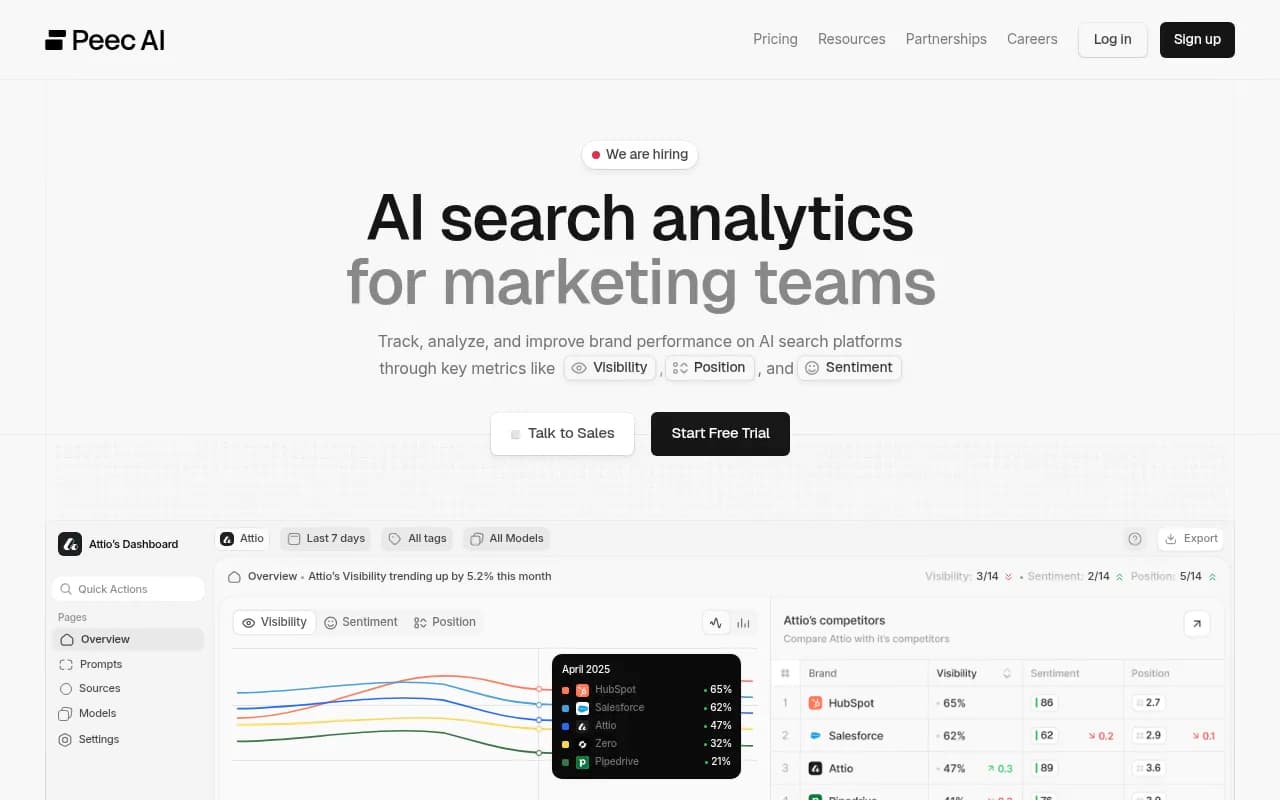
OtterlyAI also ships a Looker Studio connector and prebuilt template, and Peec AI has a community connector with documented fields, according to a 2026 roundup from The Rank Masters.
Option 2: call a REST API with a wide date window
If you want the real "one request" experience, use a platform whose API accepts a quarter-sized range. Promptwatch is one: its REST API v2 covers visibility, prompts, responses, citations, sentiment, crawler and visitor analytics, shopping, Ads Radar, site audit, and content, with date ranges up to 92 days. A calendar quarter is at most 92 days, so a single request returns the full period. Promptwatch also has a Looker Studio connector (see the Looker Studio feature page) and a hosted MCP server, so you can choose the path that fits your team.
The shape of the call is simple. The exact paths and parameters live in the API docs, so treat this as a pattern, not copy-paste:
curl -H "Authorization: Bearer $API_KEY" \
  "https://API_BASE/visibility?project=YOUR_PROJECT&from=2026-07-01&to=2026-09-30&group_by=model"
The values worth requesting for a quarterly report are visibility, share of voice, position, sentiment, and citations, grouped by model and by topic. Pull the previous quarter with the same call so the comparison table builds itself.
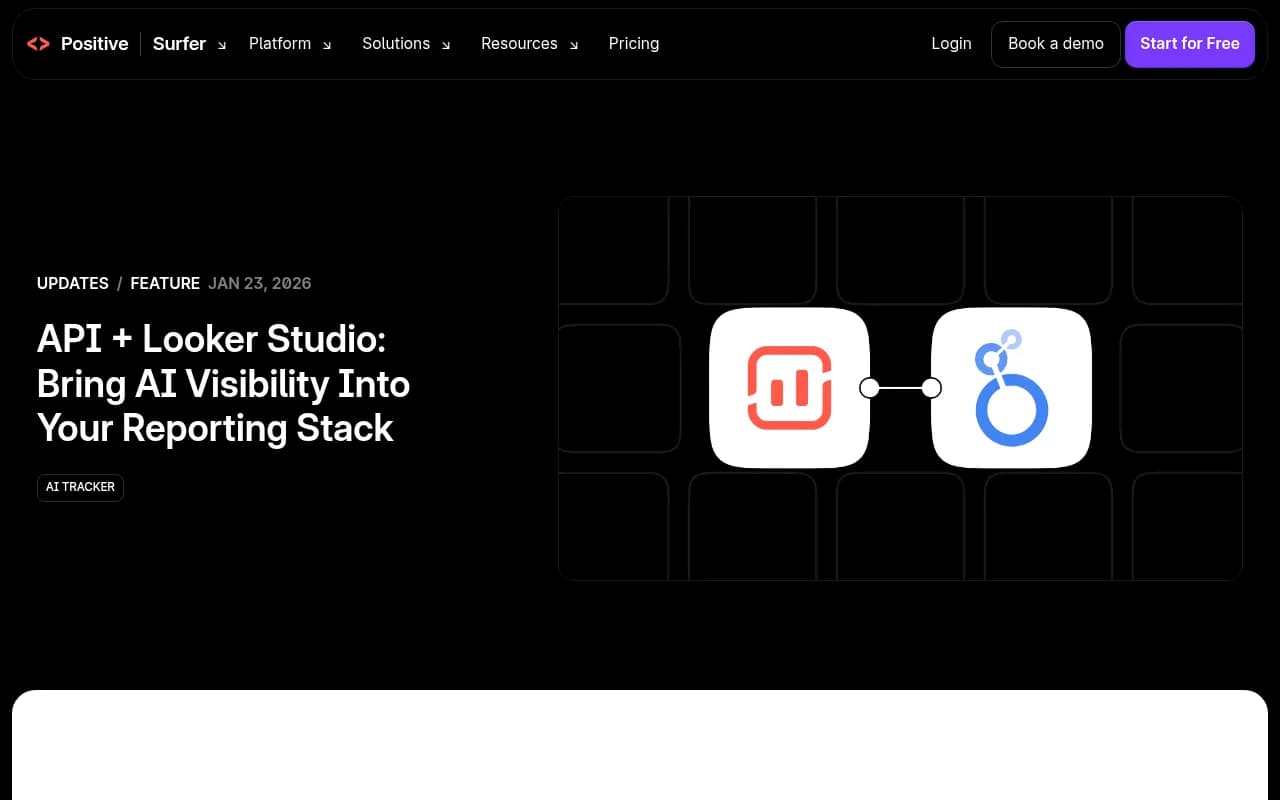
Surfer's AI Tracker also has an API and Looker Studio integration, announced January 23, 2026, though it is limited to Enterprise plans. Its pitch is blending AI visibility with GA, Google Ads, or CRM data.
Option 3: a warehouse in the middle
If you already run BigQuery or a spreadsheet pipeline, run the API call on a schedule with a tool like Zapier, Make, or n8n, write the rows to a table, and point Looker Studio at the table. It is more setup, but it protects you from API outages on the day of the board meeting and keeps history even if you change vendors.
Comparing the options
| Approach | Setup time | Code needed | Best for | Watch out for |
|---|---|---|---|---|
| Ready-made connector (LLM Pulse, OtterlyAI, Peec AI) | About 5-30 minutes | None | Fast stakeholder dashboards | Tied to one vendor's field set |
| Wide-window REST API (Promptwatch, up to 92 days per request) | A few hours | Light | Quarterly reports with custom metrics | Check rate limits and plan access |
| Enterprise API plus connector (Surfer AI Tracker) | Varies | None to light | Blending with GA, Ads, CRM | Enterprise plans only |
| Warehouse in the middle | A day or more | Moderate | Long history, heavy blending | More moving parts |
I have not verified pricing for the Otterly or Peec connectors, so confirm on their sites.
Which metrics belong in a quarterly report
Resist the urge to chart everything. A quarterly report has an audience that reads it for two minutes. Five blocks is plenty.
Visibility and share of voice
The headline number, compared with last quarter and with two or three named competitors. Promptwatch's Visibility Score runs 0-100 and counts responses that do not mention your brand as zero, so it moves when coverage moves. Share of voice shows your slice of all brand mentions. Read together they tell you whether you have a coverage problem or a prominence problem. The metrics overview explains how each one is calculated.
Citations and self-citation rate
Mentions without citations usually mean AI knows your name but does not trust your pages. Track the share of citations that point to your own domain, and report it by engine.
Sentiment
Keep it separate from visibility. A brand can be highly visible and described badly. Most tools give a score or bucketed breakdown. Report the net movement, plus one or two example claims AI makes about you.
Traffic and conversions from AI
This is the block executives care about, and it is where a reporting stack beats a standalone dashboard. Blend AI-referred sessions from analytics with visibility. One practical note: ChatGPT stopped sending a referrer on October 8, 2026, so tag links with utm_source=chatgpt.com or your AI traffic will quietly drop into direct. The attribution guide covers the options.
Actions taken and what moved
A short list of what you published or fixed during the quarter, matched to the pages that gained citations. Without it, the report is weather. With it, the report is evidence.
Engines are not interchangeable
This is where most quarterly reports go wrong. They average everything into one number and hide the differences.
Promptwatch Data's average sources per response report shows why. ChatGPT cites about 5 sources per web-search answer, Google AI Overviews about 10, and Perplexity almost exactly 10 with barely any daily movement. Microsoft Copilot swung from under 2 to nearly 17 sources within a few weeks, then settled at the low end. If you compute citation rate across all four, the result mostly reflects which engines you happened to track more prompts on.
The fix is boring and effective. Report each engine on its own row, and keep Copilot on monthly trends instead of weekly snapshots. Perplexity, being steady, makes a decent test bench for whether your changes are working.
Expect step changes and annotate them
Citation mixes can flip within days. Promptwatch Data's Reddit citations report shows reddit.com's share of ChatGPT citations falling from roughly 4% to 0.5% on August 14, 2026. The social media citations report for Sep 28 to Oct 4, 2026 puts all social platforms at 0.46% of ChatGPT citations versus 12.2% for Google AI Overviews, about 26 times higher.
If your Q3 report shows a Reddit-driven visibility drop in ChatGPT, that is not a failure of your strategy. It is a platform change. Add a dated annotation to the chart, and state it in one sentence under the table. Otherwise someone will ask why the line fell and you will be explaining it live.
A few habits that help:
- Keep a changelog of model rollouts, retrieval changes, and your own site changes next to the dashboard.
- Compare quarter over quarter and also against the trailing four-quarter average once you have the history.
- Fix your prompt set at the start of the quarter. Changing prompts mid-quarter breaks comparisons.
- Lock the monitor's country and language. Mixed markets make averages meaningless.
Building the report step by step
1. Fix the scope
Choose the brand, three to five competitors, the engines, and the markets. Write them down. This list is the contract for the quarter.
2. Connect the data
Install the connector or create the API data source. Use the widest date range your tool allows so you can switch the report between this quarter and last without reconnecting.
3. Pull current and previous quarter
Two requests, or one request with a date comparison if the connector supports it. Looker Studio's comparison date range handles the delta columns.
4. Blend with traffic data
Join AI-referred sessions and conversions from GA4 on date. Use a shared dimension like week or month. Keep the join simple. A scatter of weekly visibility against AI-referred sessions is enough to start a conversation.
5. Add the narrative layer
Two or three text boxes: what changed, why we think it changed, what we are doing next quarter. The charts show what happened. Nobody reads them without this part.
6. Schedule delivery
Looker Studio can email a PDF on a schedule. Set it for the first Monday after the quarter closes. Promptwatch can also send scheduled PDF reports from its own dashboards if you want a backup copy.
What about AI inside Looker Studio itself?
People on Reddit ask whether Looker Studio can generate AI insights from a report. The most-cited answer in that thread is Looker Studio Pro with the built-in Gemini integration, which is rolling out AI-assisted summaries. Useful for a first-pass read of your charts. I would not let it write the narrative layer for you, because it does not know about the model update that happened in week six.
Picking a tool for this workflow
If you only need a good-looking dashboard fast, a ready-made connector wins. If you want the quarterly report to be one API call that also includes crawler activity, visitor analytics, and citations by page, you need a platform with a broad API. Promptwatch fits that second case, and starts from $95/month on the Essential plan with a 7-day free trial on monthly billing, so check pricing for the current details. For a wider look at what is available, the GEO software directory lists dozens of options.
Final checklist
- Confirm the API's maximum date range covers 90+ days.
- Segment every citation metric by engine.
- Freeze the prompt set and markets for the quarter.
- Tag AI-referred links so traffic is attributable.
- Annotate step changes with dates.
- Pair every chart with one sentence of explanation.
Do those six things and your next quarterly AI visibility report will survive the first hard question from the room.