Key takeaways
- A useful GEO dashboard answers three questions: where do we appear, why, and did our last change work. Start from those, then pick widgets.
- Heatmaps work best when you put brands, models, topics or personas on the two axes and color by one metric at a time (visibility, sentiment, position or share of voice).
- A/B period comparisons only mean something if you annotate model changes and pick a window that matches how fast your content type decays.
- Never compare raw citation counts across engines. ChatGPT cites about 5 sources per web-search answer, Google AI Overviews and Perplexity about 10.
- Segment by prompt intent. Commercial, informational and branded prompts cite very different content types, so a blended view hides the real picture.
Why build a custom dashboard at all
Most GEO tools ship with a default overview: one visibility score, a line chart, a list of competitors. It looks fine in a demo. Then your CFO asks whether the pricing page refresh did anything, and the default view can't say.
A custom dashboard fixes that by being opinionated. You choose which numbers sit next to each other, which time periods get compared, and which breakdowns are one click away. The goal isn't more charts. It's fewer charts, each tied to a decision.
I'll walk through the process in the order I'd actually do it: define questions, choose widgets, build heatmaps, set up A/B period comparisons, then share and automate. The examples use Promptwatch, because its custom dashboards, heatmaps and A/B chart cover this workflow in one place, but the logic applies to any GEO platform that lets you arrange widgets.
Step 1: Write the questions before you touch a widget
The fastest way to build a bad dashboard is to open the widget library first. Write down the questions instead. A reasonable starter set:
- Are we more or less visible than last month, and on which models?
- Which topics do competitors win and we don't?
- Which of our pages get cited, and which get crawled but never cited?
- Is sentiment drifting on pricing or features?
- Did the content we published three weeks ago change anything?
Each question maps to a metric family. Coverage questions map to Share of Voice. Prominence questions map to average position. Mentions without citations point at content or crawlability. Weak sentiment is a reputation problem. If you can't say which metric answers a widget's question, cut the widget.
It also helps to decide the audience. A dashboard for a CMO needs four or five widgets and a trend. A dashboard for the SEO lead can carry fifteen. Build two rather than one compromise.
Step 2: Pick widgets that answer those questions
Widget libraries vary, but the useful ones fall into a few groups. Promptwatch's custom dashboards let you choose and order widgets such as visibility over time, sentiment, a visibility-by-country map, the heatmap, a persona radar, top cited domains and URLs, and top YouTube videos, Reddit posts and LinkedIn posts. It also has templates (Competitor comparison, Topic gaps, AI model breakdown, Citations) that are a better starting point than a blank canvas.
| Question | Widget | Metric to read |
|---|---|---|
| Are we gaining or losing ground? | Visibility over time | Visibility Score (0-100) |
| Who is eating our share? | Competitor comparison | Share of Voice |
| Which markets are weak? | Visibility by country map | Visibility by country |
| Which sources does AI trust? | Top cited domains and URLs | Citation share, citation rank |
| Do different buyers see different answers? | Persona radar | Visibility, position, sentiment per persona |
| Where is the narrative off? | Sentiment widget | Sentiment score (about 50 is neutral) |
| Is social doing anything? | Reddit, YouTube, LinkedIn widgets | Cited posts and videos |
A rule I use: one hero widget, then supporting widgets that explain movement in the hero. If the hero is Visibility Score over time, the supporters are the model breakdown (which engine moved it) and the topic view (which subject moved it). Anything that doesn't explain the hero is decoration.
Ordering matters more than people think
Put the question people ask first at the top left. Put diagnostic widgets below. Executives read the top row and stop, so whatever is there should be self-sufficient.
Watch the denominator problem
Promptwatch Data shows that the number of sources per answer differs a lot by engine. In its average sources per response report, ChatGPT cites about 5 sources per web-search answer, Google AI Overviews about 10, and Perplexity almost exactly 10 every day. Microsoft Copilot swung from under 2 to nearly 17 within a few weeks before settling low.
The practical consequence: a raw count of 40 citations on ChatGPT and 40 on AI Overviews are not equivalent. Use share-based metrics (citation share, self-citation rate) for cross-engine widgets, and keep raw counts to single-engine views. For Copilot, judge monthly trends, not weekly snapshots.
Step 3: Build heatmaps that actually point somewhere
A heatmap is just a grid with color. It earns its place when it shows you a pattern a line chart can't. In web analytics, heatmaps show where users click and scroll, and tools like CUX and Wingify use them to explain why a variant won or lost. The idea carries over directly to GEO: the numbers tell you what changed, the heatmap tells you where.
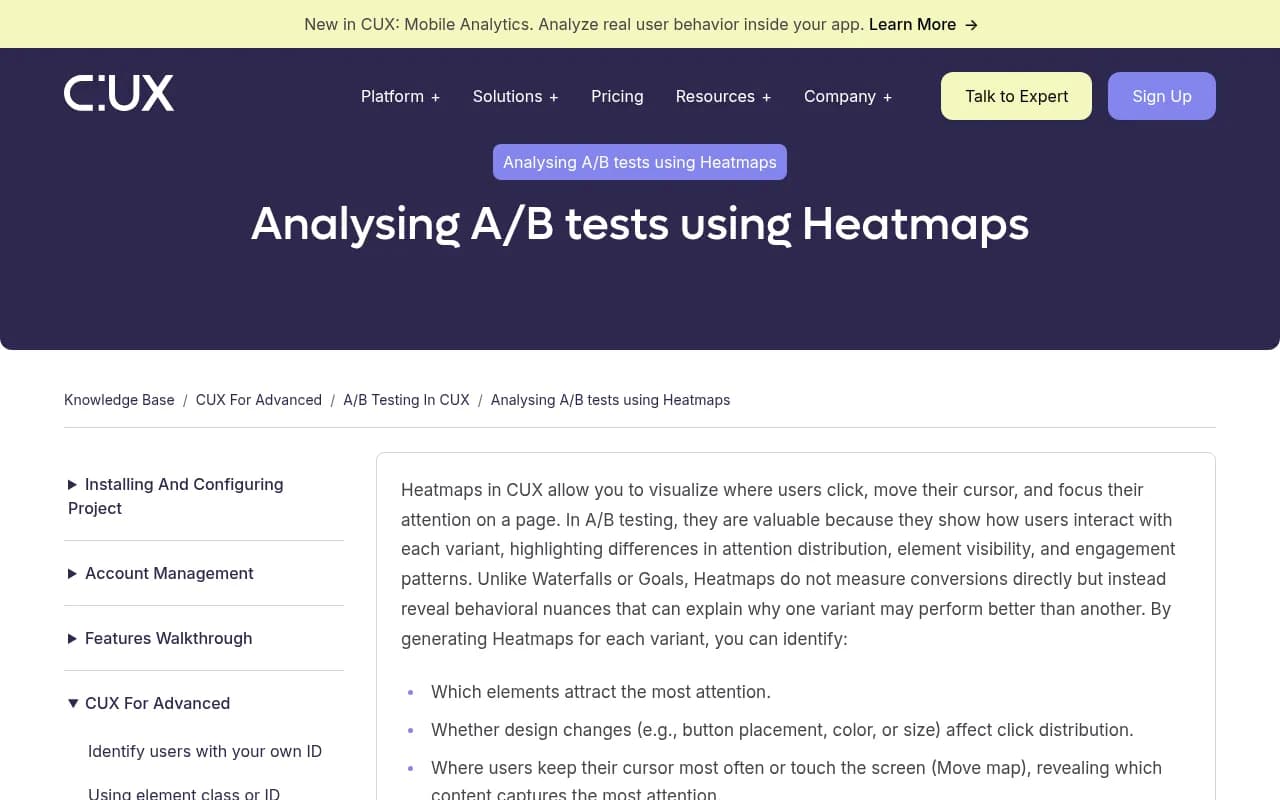
The CUX guide makes a point worth borrowing: generate and read heatmaps separately for each variant, and use grouped views instead of single-page noise. In a GEO context, "grouped" means aggregating across many prompts in a topic rather than staring at one prompt's result.
Choosing the axes
Promptwatch's heatmap lets you put brands, models, topics, countries or personas on either axis, colored by Visibility, Sentiment, Position or Share of Voice. That's a lot of combinations. These are the five I'd build first:
- Brands by models, colored by Visibility. Shows whether you're strong on ChatGPT but invisible on Gemini.
- Brands by topics, colored by Share of Voice. Your content gap map.
- Brands by topics, colored by Sentiment. Finds the one subject where AI says something unflattering.
- Models by countries, colored by Visibility. Useful for multi-market brands, because AI Overviews are region-specific.
- Brands by personas, colored by Position. Reveals whether you're early in the answer for one buyer type and late for another.
Change one thing at a time. If you swap both axes and the metric, you can't tell why the picture changed.
Segment by prompt intent
The content-type mix AI cites is not uniform. In Promptwatch Data's ChatGPT content type report (Sep 28 to Oct 4, 2026), product pages were the most cited type at 22.4% of all citations, then landing pages at 16.8% and listicles at 13.6%. But commercial prompts leaned harder on product pages (26.0%) and landing pages (20.6%), informational prompts spread more across how-to guides (10.7%) and docs (8.5%), and branded prompts gave reviews and FAQ pages a visible slice.
So a blended heatmap hides things. Build one monitor or filter per intent, and compare. A topic that looks healthy overall may be invisible specifically on commercial prompts, which is where the revenue is.
Reading a heatmap without fooling yourself
- A single hot cell is a story. A hot row is a pattern.
- Check the prompt count behind a cell. Five prompts is an anecdote.
- Cold cells for competitors are opportunities. Cold cells for you are your backlog.
Step 4: Set up A/B period comparisons
Here's where dashboards usually go wrong. Comparing "this week vs last week" feels like an A/B test. It isn't one. There's no randomization, models update without warning, and prompts get added mid-period. You can still get honest signal if you control for it.
The Contentsquare guide to A/B testing dashboards makes the right structural point for web tests: put control and variant side by side across key metrics, then contextualize with behavior data. GEO needs the same shape, with period A as control and period B as variant.
Pick the right window
Citation lifetimes differ by content type. Promptwatch Data's content half-life report found that, among pages ChatGPT cited on July 6, 2026, landing pages and docs stayed cited longest, while news lost half its pages within 36 days. That tells you how to size comparisons:
| Content you changed | Suggested comparison window | Why |
|---|---|---|
| News or timely posts | 2 to 4 weeks, tight | Citations decay fast, so effects fade |
| How-to guides, listicles | 4 to 6 weeks | Medium lifespan |
| Landing pages, docs, product pages | 6 to 12 weeks | Stay cited for months, slow to show change |
Hold the prompt set constant
Both periods must run the same prompts, in the same countries and languages, on the same models. Promptwatch fixes a monitor's language and location at creation, which helps. If you add prompts mid-test, tag them and exclude them from the comparison.
Annotate the step-changes
Engines change under you. Promptwatch Data recorded ChatGPT starting to use the site: operator at scale on August 8, 2026, jumping from about 0.4% to about 17% of fan-out queries, per its site: operator report. Around the same time, reddit.com's share of ChatGPT citations fell from roughly 4% to 0.5% on August 14, 2026, covered in the Reddit citations report. If your comparison period spans either date, a visibility change might have nothing to do with you.
Keep a running note of model rollouts, retrieval changes and your own publish dates. Then read the A/B chart with those dates in mind.
Use a stable engine as a test bench
Promptwatch's sources-per-response data suggests Perplexity is unusually steady at about 10 citations a day, which makes it a decent GEO test bench: if your citations move there, your content probably caused it. Treat that as a hypothesis, not proof, and cross-check on other models.
What to compare
In the A/B chart, put these side by side for period A and period B:
- Visibility Score and Share of Voice (coverage)
- Average position (prominence)
- Self-citation rate (are your own pages the sources?)
- Sentiment by theme (did the narrative move?)
If visibility rose but self-citation didn't, AI is mentioning you based on other people's pages. That's an offsite story, not a win for the page you just rewrote.
Step 5: Add the evidence layer
Heatmaps and period charts show outcomes. To know why, you need one or two widgets that show causes. Wingify's piece on heatmaps for A/B test analysis frames it well: conversion numbers tell you what changed, behavior data explains why a promising variation didn't win.
The GEO equivalent is crawl and traffic data next to visibility data:
- AI crawler logs show whether bots actually read the page you changed. If GPTBot never fetched it, a flat result is an access problem. Promptwatch's AI crawler logs verify visits against operators' IP ranges.
- Page-level citation tracking shows whether that specific URL appears in answers and where it lands in the source list.
- Visitor analytics shows whether any of it sends traffic. Note that ChatGPT stopped sending a referrer on October 8, 2026, so tagging links with utm_source=chatgpt.com matters if you want clean attribution. The Academy guide on attributing AI traffic covers the setup.
One diagnostic row at the bottom of your dashboard, with crawls, citations and visits for the pages you changed, turns a mystery into a checklist.
Step 6: Share it, schedule it, let the assistant help
A dashboard nobody opens is a hobby. Three habits make it stick:
- Export PDFs of the dashboard on a schedule to the people who care. Promptwatch can send scheduled PDF reports that follow the dashboard as it changes.
- Keep a team dashboard and personal ones. Personal views are where analysts experiment without cluttering the shared one.
- Let an assistant build the first draft. Promptwatch's Agent Chat or its MCP server can build or edit a dashboard on request, which beats dragging widgets for twenty minutes.
If your team lives in a BI tool instead, the Looker Studio connector and REST API cover that, with date ranges up to 92 days per request so a full quarter fits in one pull.
Tool options at a glance
Not every GEO tool lets you shape the dashboard. This is a rough guide to the categories in our directory; check each product's current features before deciding.
| Approach | Typical examples | Customization | Good fit |
|---|---|---|---|
| End-to-end GEO platform with custom dashboards | Promptwatch | Widgets, heatmaps, A/B chart, templates, PDF scheduling | Teams that want to act on the data too |
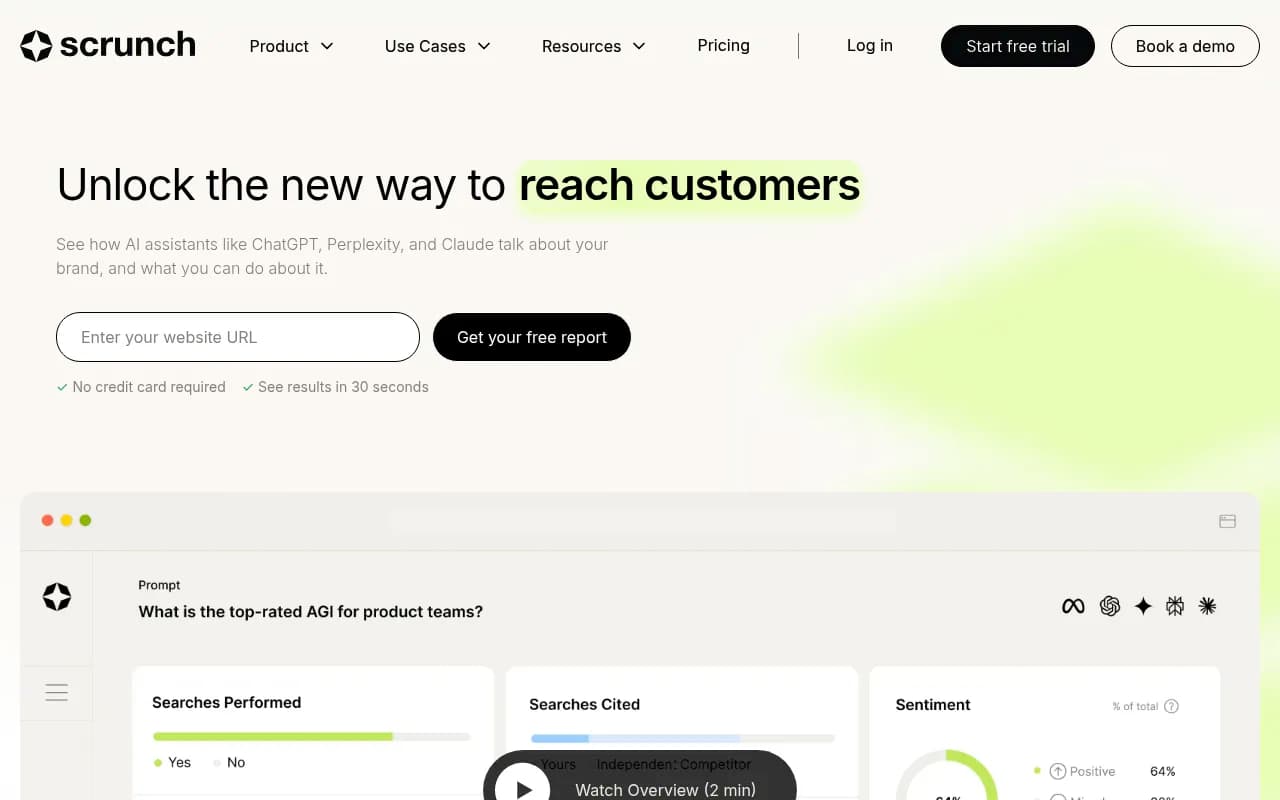
| Enterprise monitoring suites | Profound, Scrunch | Strong monitoring views | Large brands with monitoring budgets |
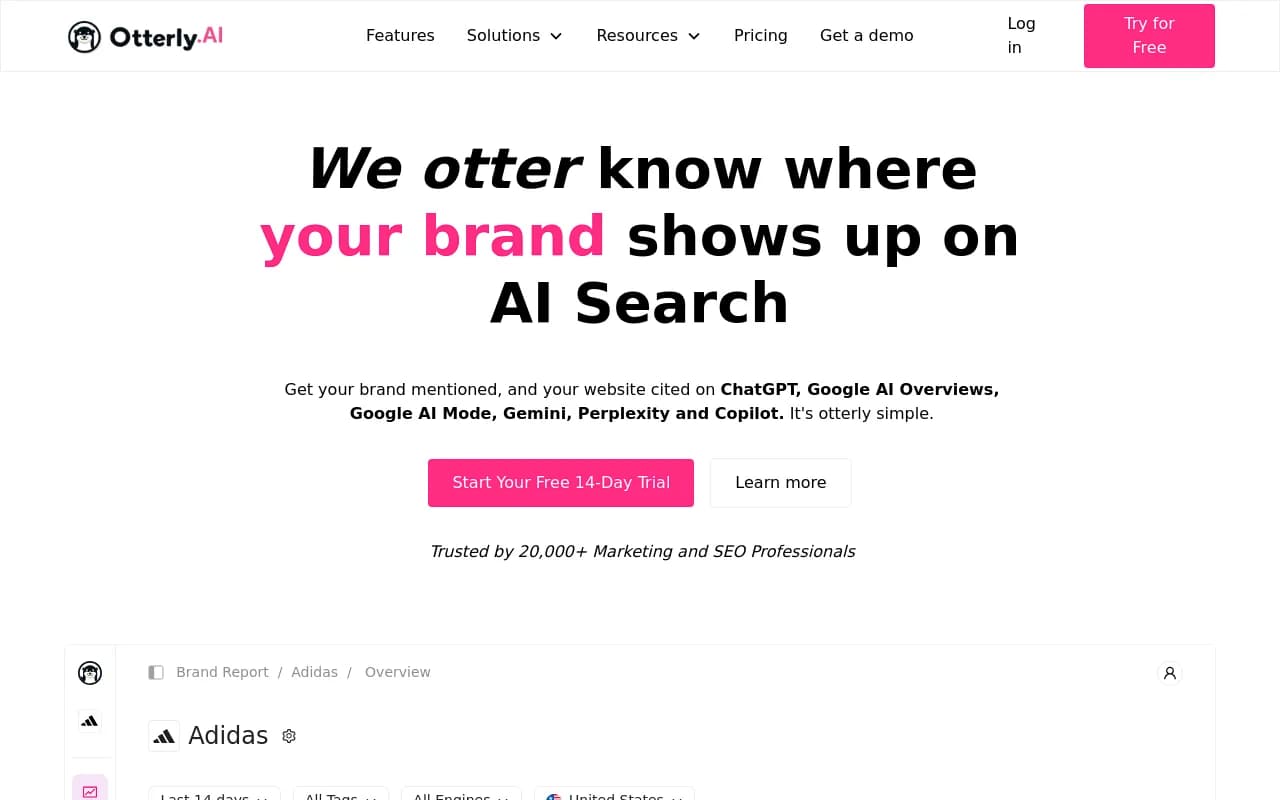
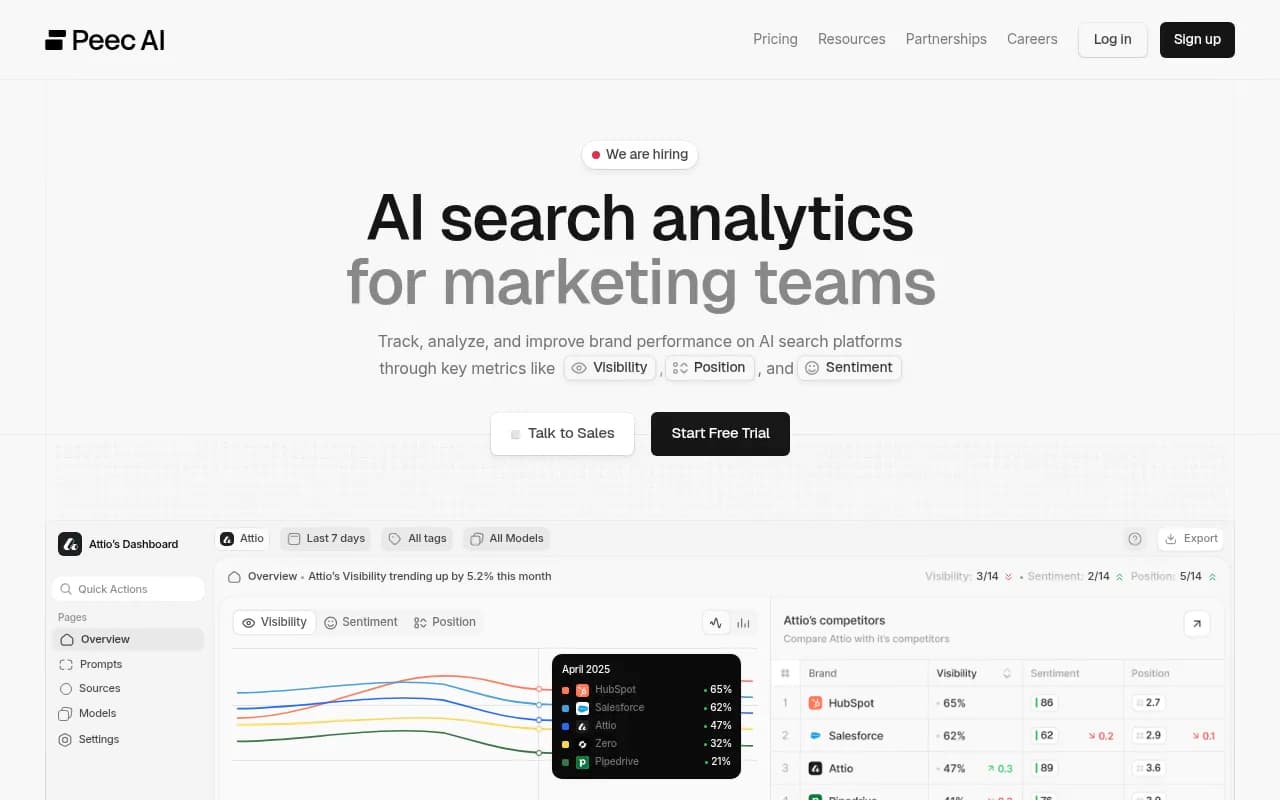
| Lightweight trackers | Otterly.AI, Peec AI | Fixed reports, fewer layout options | Quick visibility checks |
| SEO suites with AI add-ons | Semrush, Ahrefs Brand Radar | Existing SEO reports, shallower AI data | Teams already inside those suites |
| Reporting layers | AgencyAnalytics, Looker Studio | Flexible layout, you bring the data | Agencies building client reports |


If you're still shortlisting, the GEO software directory lists far more options by category.
Promptwatch is the one I'd pick for this specific job because the dashboard sits on top of a full loop: monitor, trace citations, act through the Action Board and Content Agent, then measure. Most competitors stop at the monitoring layer, so a custom dashboard there is a nicer view of the same limited data. You can start with the 7-day free trial or run the free AI visibility report first; confirm current plans at promptwatch.com/pricing.
A sample dashboard layout
Here's a layout that works for a mid-sized brand. Adjust the topics, not the structure.
- Top row: Visibility Score over time (hero), Share of Voice vs top three competitors, sentiment score.
- Second row: brands by models heatmap (Visibility), brands by topics heatmap (Share of Voice).
- Third row: A/B chart comparing the last full period to the one before, with annotations for model changes and publish dates.
- Fourth row: top cited domains and URLs, plus Reddit and YouTube widgets if your category leans on them.
- Bottom row: crawls, citations and visits for pages changed in the period.
Build it once, then clone it per market or product line. Because monitors fix language and location, each clone stays clean.
Common mistakes
- Too many widgets. If you can't scan it in thirty seconds, split it.
- Mixing intents. A blended number hides the commercial-prompt gap.
- Comparing engines on raw counts. Normalize first.
- Declaring victory on a two-week change for a landing page. These pages decay slowly and respond slowly.
- Ignoring sentiment because visibility looks good. They're scored independently, and a visible brand with weak sentiment is a problem, not a win.
Where to go next
Build the five heatmaps above, set one A/B comparison with a window matched to the content you changed, and write down the model changes inside it. Review it for a month before adding anything. If you're pairing this with the agency side of AI search, 1001 SEO Media runs GEO programs on Promptwatch and can set up the reporting layer for you. For more reading, Promptwatch's Academy has metric definitions, and the Promptwatch Data hub has the benchmarks to sanity-check your own numbers.