Key takeaways
- Most AI visibility tools now offer at least one path into Looker Studio: a native connector, a REST API, or a middleware-compatible export
- Native connectors (like those from Writesonic and LLM Pulse) are the fastest route but often come with limited field flexibility
- REST APIs give you full control over which fields land in your dashboard, but require either coding skills or a middleware layer like Zapier, Make, or Coupler.io
- The real value isn't the connection itself -- it's blending AI visibility scores with GA4, Search Console, and revenue data in a single view
- Tools vary significantly in what they expose via API: some give you prompt-level citation data, others only surface aggregate visibility scores
AI visibility data has a presentation problem. The numbers sit inside a specialist tool -- your GEO platform, your AI tracker -- and the people who need to act on them are looking at a Looker Studio dashboard that shows GA4 sessions, Search Console clicks, and paid spend. Two separate worlds.
The fix isn't complicated, but it does require a decision: do you want a native connector, a direct API integration, or a middleware pipeline? Each approach has real tradeoffs, and the right choice depends on how much control you need over the data and how much engineering time you want to spend.
This guide walks through all three methods, covers which AI visibility tools support each approach, and shows you how to build a dashboard that actually tells a coherent story.
Why blending AI visibility with traditional metrics matters
Before getting into the mechanics, it's worth being clear about why this is worth doing at all.
AI visibility scores on their own are hard to defend in a business review. "We're mentioned in 34% of ChatGPT responses for our target prompts" sounds interesting, but it doesn't connect to anything leadership already tracks. When that same metric sits next to organic traffic, conversion rate, and revenue in a Looker Studio dashboard, the conversation changes. You can start asking whether AI visibility improvements correlate with traffic lifts. You can show that a competitor gaining ground in Perplexity responses preceded a drop in your branded search volume.
That's the actual use case here -- not just pulling data for the sake of it, but building a feedback loop between AI search presence and business outcomes.
The three methods for connecting AI visibility data to Looker Studio
Method 1: Native Looker Studio connectors
Some AI visibility tools have built a direct connector to Looker Studio, which means you authenticate once and the data flows in without any coding. This is the fastest path and the right choice if you want to get a dashboard running in an afternoon.
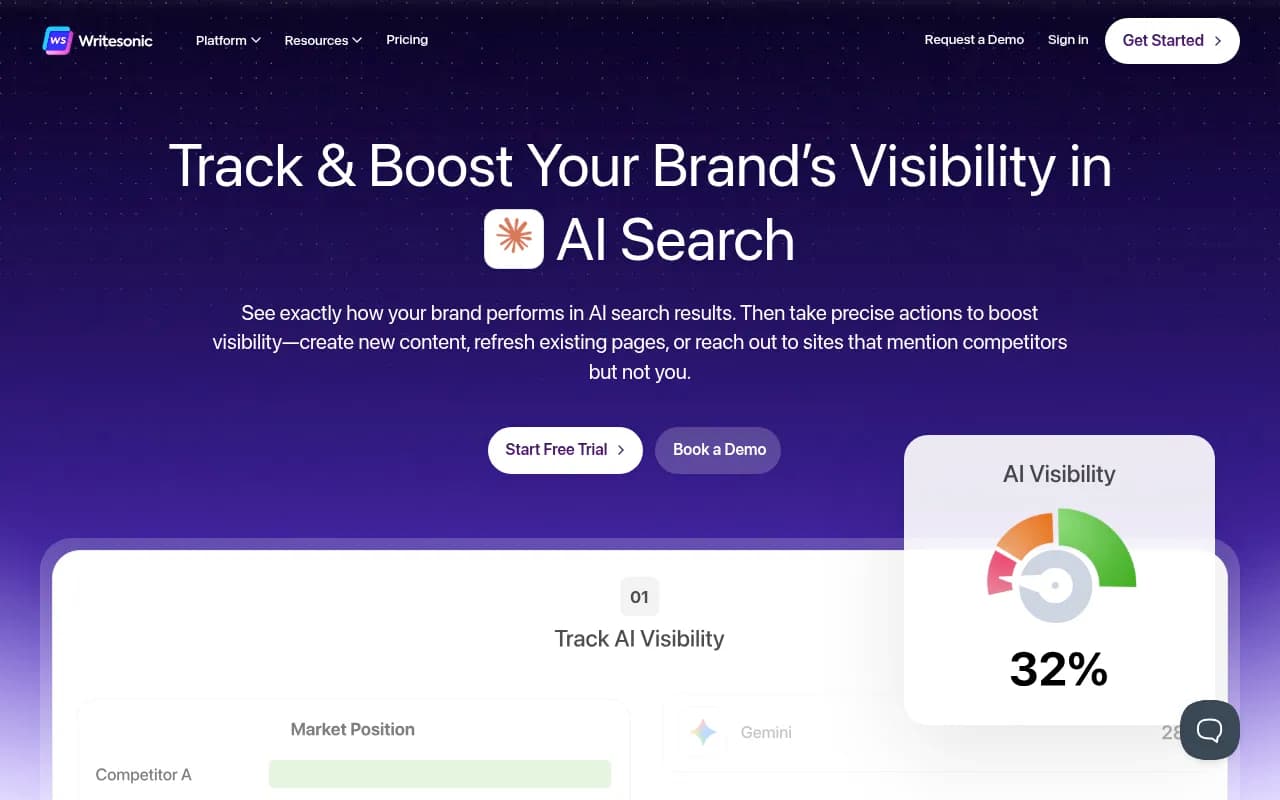
Writesonic has a native Looker Studio integration that lets you pull AI search visibility data directly into reports alongside GA4 and Search Console. You can build custom dashboards that show how your brand appears across ChatGPT, Perplexity, Gemini, and other models without touching an API.
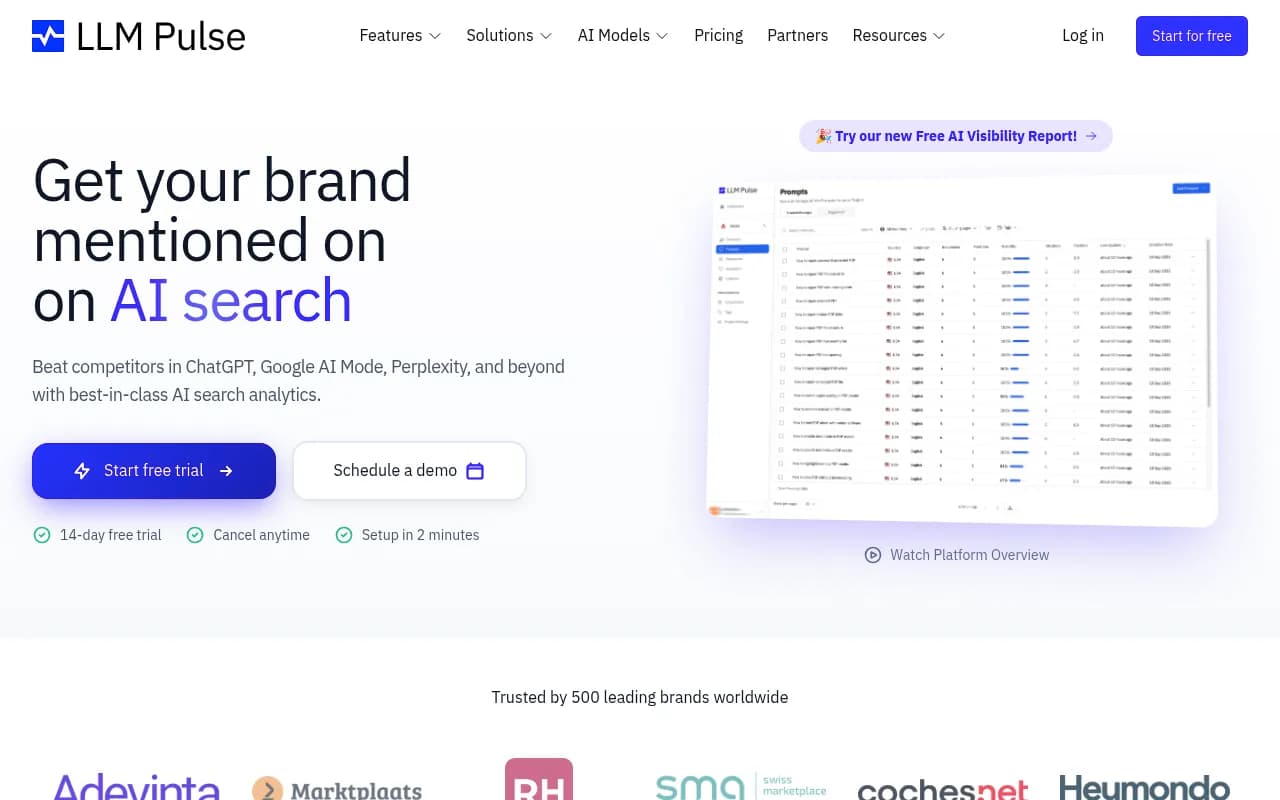
LLM Pulse offers a pre-built dashboard template that connects directly to its data via a Looker Studio integration. The template visualizes AI visibility metrics out of the box, which is useful if you don't want to build a dashboard from scratch.
The tradeoff with native connectors is flexibility. You're working with whatever fields the tool decides to expose, and you can't always reshape the data model to match how your team thinks about visibility. If you need custom calculated fields or want to join AI visibility data with a CRM export, you'll hit walls.
Method 2: REST API + Looker Studio community connector
This approach gives you the most control. You call the tool's API, get structured JSON back, and then pipe that into Looker Studio either through a custom community connector (built in Apps Script) or by staging the data in a Google Sheet or BigQuery first.
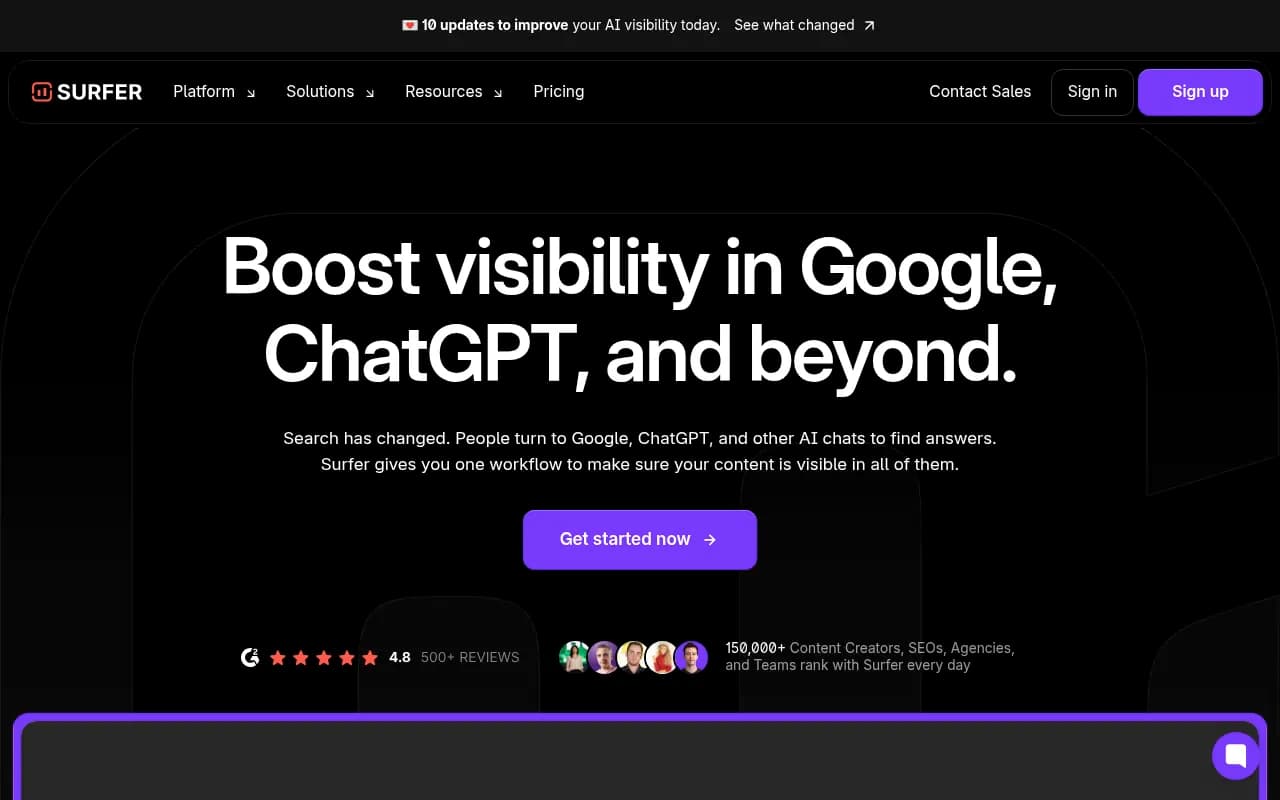
Surfer SEO's AI Tracker (enterprise tier) exposes an API that lets you export AI visibility data to internal systems and connect it to Looker Studio. The announcement from January 2026 specifically calls out blending AI visibility with GA, Google Ads, and CRM data as the core use case.
Profound has a REST API with official SDKs, which makes it one of the cleaner options for teams that want to build a proper BI pipeline. You can pull prompt-level visibility data and land it in a warehouse before connecting to Looker Studio.
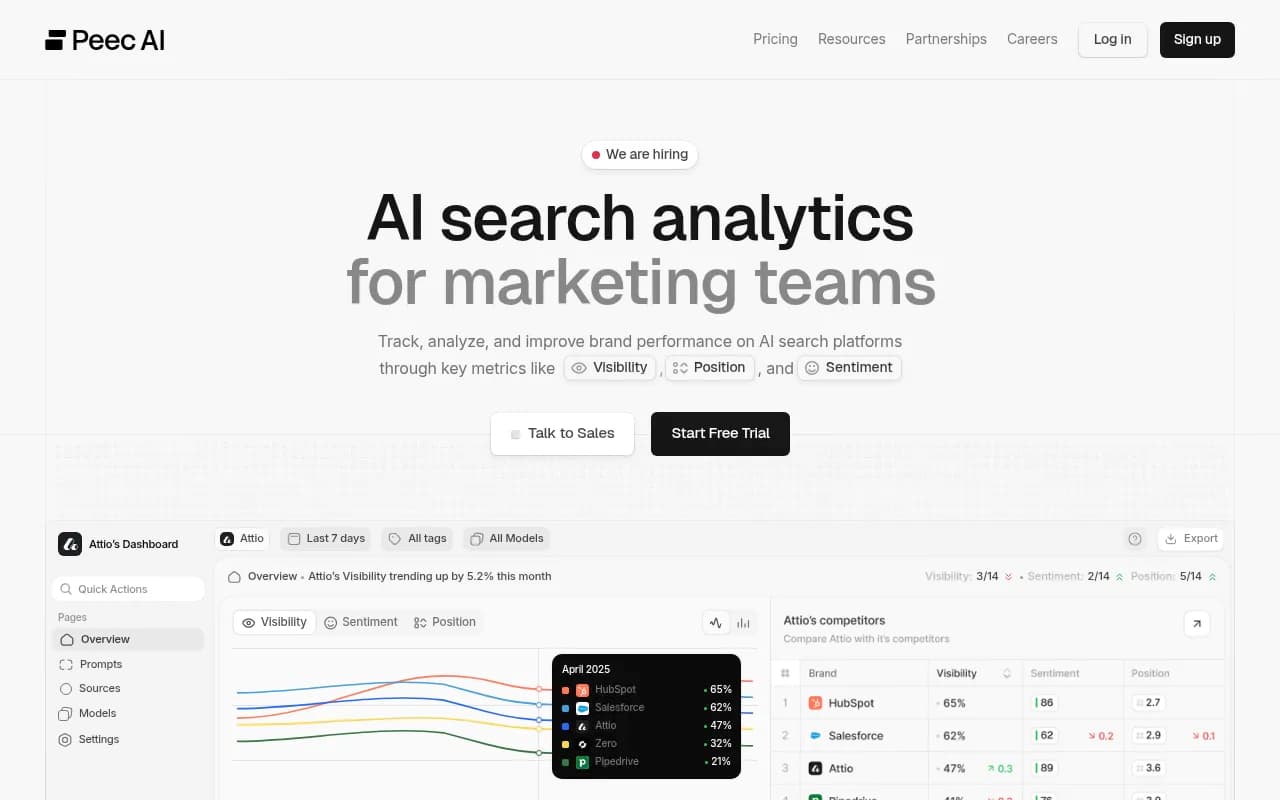
Peec AI has a community connector with documented fields, which is a good middle ground -- you get more flexibility than a native connector without needing to write a full API integration from scratch.
For tools that have an API but no Looker Studio connector, the typical pattern is:
- Call the API on a schedule (daily or weekly)
- Write the response to a Google Sheet or push it to BigQuery
- Connect Looker Studio to that Sheet or BigQuery table
- Build your blended report from there
This is more work upfront but gives you a stable, version-controlled data pipeline that doesn't break when the tool updates its UI.
Method 3: Middleware and no-code automation
If you don't want to write API calls yourself but need more flexibility than a native connector offers, middleware tools like Zapier, Make, or Coupler.io sit in the middle. They handle the authentication, scheduling, and data transformation, and most of them have Looker Studio or Google Sheets as an output destination.
The practical workflow here looks like this: set up a trigger in your middleware tool that fires on a schedule, calls your AI visibility tool's API, maps the response fields to a spreadsheet schema, and writes the rows to Google Sheets. Looker Studio then reads from that sheet in near-real-time.
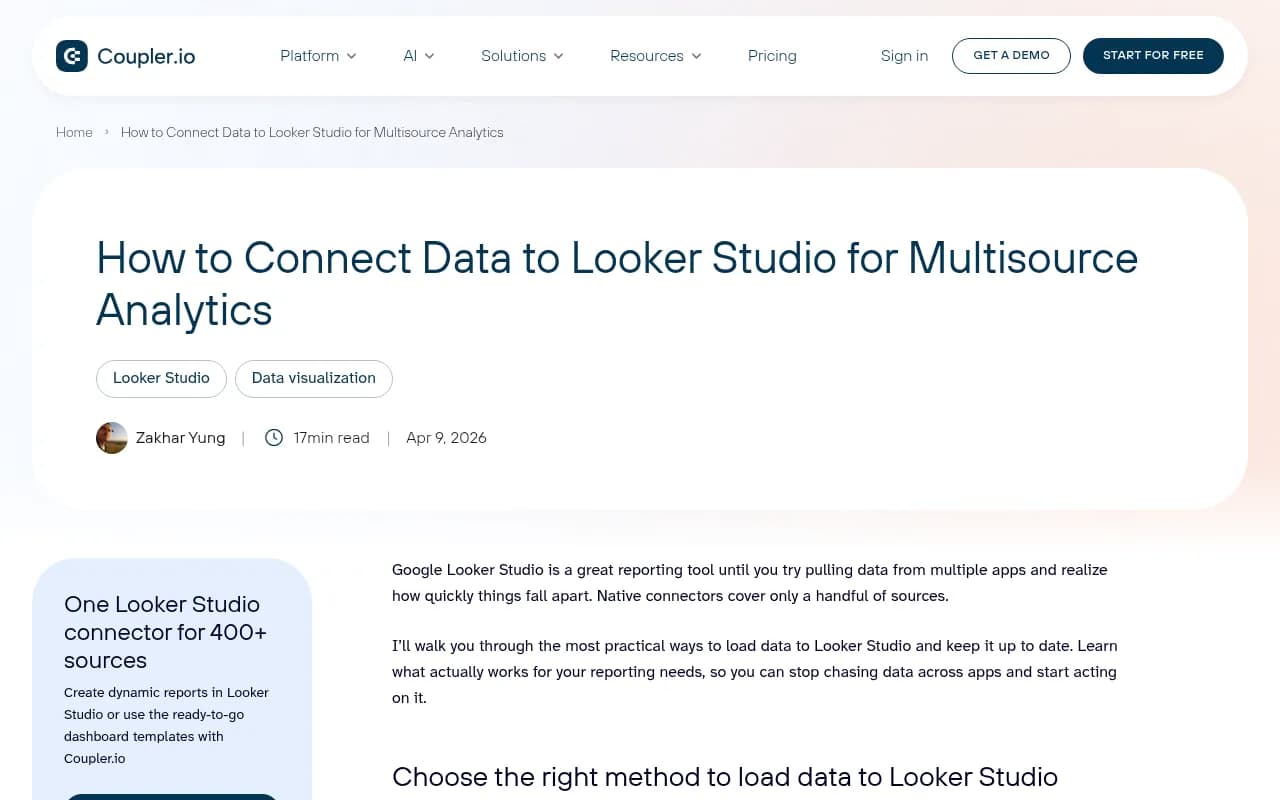
Coupler.io is worth a specific mention for this use case -- it's built specifically for loading data into Looker Studio from multiple sources, handles refresh scheduling, and has a connector library that covers a lot of marketing and analytics tools. It won't have a pre-built AI visibility connector for every tool, but if your tool has a REST API, you can configure a custom HTTP source.
Which AI visibility tools support Looker Studio integration in 2026
Here's a practical comparison of the tools that have some form of Looker Studio or API integration:
| Tool | Native Looker connector | REST API | Middleware-friendly | Notes |
|---|---|---|---|---|
| Writesonic | Yes | Yes | Yes | Native connector + GEO data fields |
| LLM Pulse | Yes (template) | Yes | Yes | Pre-built dashboard template |
| Surfer SEO AI Tracker | No | Yes (Enterprise) | Yes | Enterprise-only API |
| Profound | No | Yes (with SDKs) | Yes | Best for BI pipelines |
| Peec AI | Community connector | Yes | Yes | Documented fields |
| Promptwatch | Yes (API + GSC integration) | Yes | Yes | Also has Looker Studio integration + traffic attribution |
| Otterly.AI | No | Limited | Limited | Monitoring-focused, limited export |
| AthenaHQ | No | Limited | Limited | No content pipeline |
Promptwatch is worth calling out here because it goes beyond just exposing data -- it has a Looker Studio integration alongside traffic attribution via Google Search Console, a code snippet, or server log analysis. That means you can close the loop between AI visibility and actual traffic in one reporting environment.
Step-by-step: Building a blended AI visibility dashboard in Looker Studio
Here's the practical sequence for the most common setup -- using a tool's API, staging data in Google Sheets, and blending with GA4 and Search Console.
Step 1: Get your API credentials
Log into your AI visibility tool and find the API section (usually under Settings > API or Developer). Generate an API key and note the base URL and available endpoints. Most tools will have endpoints for:
- Visibility scores by prompt or keyword
- Citation counts by AI model
- Competitor comparison data
- Historical trend data
Read the documentation carefully for rate limits and pagination -- AI visibility APIs often return large datasets and you'll need to handle pagination to get complete history.
Step 2: Set up a data staging layer
Google Sheets is the simplest option. Create a sheet with column headers that match the fields you're pulling from the API. If you're comfortable with Apps Script, you can write a function that calls the API and writes rows to the sheet on a time-based trigger.
A basic Apps Script pattern looks like this:
function fetchAIVisibilityData() {
  const apiKey = 'YOUR_API_KEY';
  const url = 'https://api.yourtool.com/v1/visibility?prompt_set=branded';

  const response = UrlFetchApp.fetch(url, {
    headers: { 'Authorization': 'Bearer ' + apiKey }
  });

  const data = JSON.parse(response.getContentText());
  const sheet = SpreadsheetApp.getActiveSheet();

  data.results.forEach(row => {
    sheet.appendRow([
      new Date(),
      row.prompt,
      row.visibility_score,
      row.citation_count,
      row.model
    ]);
  });
}
Set this to run daily via Apps Script triggers. If you'd rather not write code, use Make or Zapier to do the same thing with a visual workflow.
For larger datasets or teams that need more reliability, push to BigQuery instead of Sheets. BigQuery handles millions of rows without performance issues and gives you SQL for more complex transformations before the data hits Looker Studio.
Step 3: Connect Looker Studio to your data source
In Looker Studio, click "Add data" and select either Google Sheets or BigQuery depending on where you staged the data. Map your fields -- make sure date fields are recognized as Date type, and numeric fields like visibility scores are set to Number rather than Text.
Step 4: Blend with GA4 and Search Console
This is where the dashboard gets useful. In Looker Studio, use the "Blend Data" feature to join your AI visibility data with GA4 sessions and Search Console impressions on a date dimension. You'll need a common key -- date works for most use cases, though if you're tracking at the keyword/prompt level you can try to join on query strings too.
A useful blended view shows:
- AI visibility score (from your GEO tool) over time
- Organic impressions (Search Console) over the same period
- Organic sessions (GA4)
- Branded search volume trend
When these move together, you have something worth showing leadership.
Step 5: Add competitor comparison panels
Most AI visibility APIs return competitor data alongside your own scores. Pull that into a separate sheet or BigQuery table and add a comparison chart to your dashboard. A simple line chart showing your visibility score vs. two or three competitors over 90 days is often more compelling than any single metric.
Common problems and how to fix them
Data refresh lag: Looker Studio caches data aggressively. If your dashboard shows stale numbers, check the data source settings and reduce the cache duration. For Google Sheets sources, you can also force a refresh by running your Apps Script function manually.
Field type mismatches: AI visibility tools often return scores as strings rather than numbers. In Looker Studio's data source editor, manually set the field type to Number for any metric you want to use in calculations or charts.
API rate limits: If you're pulling data for many prompts or a long date range, you may hit rate limits. Add exponential backoff to your Apps Script or middleware workflow, and consider pulling data in smaller date chunks.
Joining on date when granularity differs: Your AI visibility tool might update daily while GA4 has hourly data. Aggregate GA4 to daily before blending to avoid row multiplication issues.
Choosing the right approach for your team
The honest answer is that native connectors are fine for most teams. If Writesonic or LLM Pulse has a connector and you're not doing anything exotic with the data, use it. You'll have a working dashboard in a few hours.
If you're at an agency managing multiple clients, or you need AI visibility data to live in the same warehouse as your paid media and CRM data, the API + BigQuery route is worth the setup time. It's more resilient, easier to audit, and scales without manual work.
If you're somewhere in the middle -- you want more than a native connector but don't have engineering resources -- middleware tools like Make or Zapier with a Google Sheets destination are a reasonable compromise.
The tools that make this genuinely easy in 2026 are the ones that treat API access as a first-class feature rather than an afterthought. Profound, Promptwatch, and Surfer SEO's enterprise tier are the clearest examples of that right now.
Whatever path you choose, the goal is the same: AI visibility data that your whole team can see, question, and act on -- not numbers that live in a tab that only the SEO team opens.