Key takeaways
- A useful GEO dashboard answers four questions: are we mentioned, where do citations come from, what traffic results, and what changed since last period.
- Start from a template, then swap the data source and trim widgets. The ArcGIS dashboard tutorial teaches this pattern well, even though the subject is maps.
- Segment by prompt intent and content type. Blended totals hide differences that are large in Promptwatch's ChatGPT data.
- An A/B period chart is only trustworthy when both periods are long enough and you compare like with like.
- Read your own movement against the engine-wide baseline, such as average citations per response.
Why build a custom GEO dashboard at all
Most AI visibility tools give you a default overview. It is fine for a first week. After that, you start asking questions the overview does not answer. Which page types get cited for commercial prompts? Did that content refresh in September change anything? Is the drop we see in Copilot ours, or the engine's?
A custom dashboard is how you stop re-running the same analysis by hand. You decide which widgets exist, in what order, and which time windows they compare. Then your team opens one page on Monday and sees the same thing every week.
This tutorial is tool-agnostic where it can be. The layout logic applies whether you build in a GEO platform, Looker Studio, or a general no-code builder. Where I name a specific feature, I will say so.
Step 1: Decide what the dashboard is for
Before touching a widget, write down the audience and the decision. A CMO dashboard and an SEO team dashboard should not look alike.
| Audience | Decision they make | Core widgets |
|---|---|---|
| Marketing leadership | Is AI search worth more budget? | Visibility score, share of voice, AI-referred conversions |
| SEO and content team | What do we write or fix next? | Topic gaps, cited pages, content type mix, crawler errors |
| Agency account lead | What do we tell the client? | Competitor comparison, A/B period chart, top cited domains |
| Developer relations | Do coding agents recommend our SDK? | Prompt-level visibility, citation sources, crawler logs |
Pick one row. If you need two, build two dashboards. A single board that tries to serve everyone ends up with 30 widgets and no reader.
Step 2: Choose widgets that map to questions
The Siteimprove help center lists the widget families most dashboard builders share: gauges, charts, graphs, maps, matrices and tables. GEO dashboards use the same families. The skill is matching the widget to the question.
Single-number widgets
Use these for the headline. Visibility score, share of voice, average position, sentiment. One number, one trend arrow. Keep it to four or five at most.
Line and area charts
Use these for change over time. Visibility by model, citations per day, AI crawler requests per week. If a number can move, it belongs in a line chart, not a tile.
Tables and ranked lists
Top cited domains, top ranked URLs, and top prompts belong here. Tables are where the action is, because a reader can click through to a specific page.
Heatmaps and matrices
A heatmap compares two dimensions at once, say brands against models, or topics against countries. They are the quickest way to spot that you are strong in ChatGPT and invisible in Perplexity for one topic.
Maps
Only worth it if location matters. For multi-location businesses, a visibility-by-country or city map is useful. For a single-market SaaS company it is decoration.
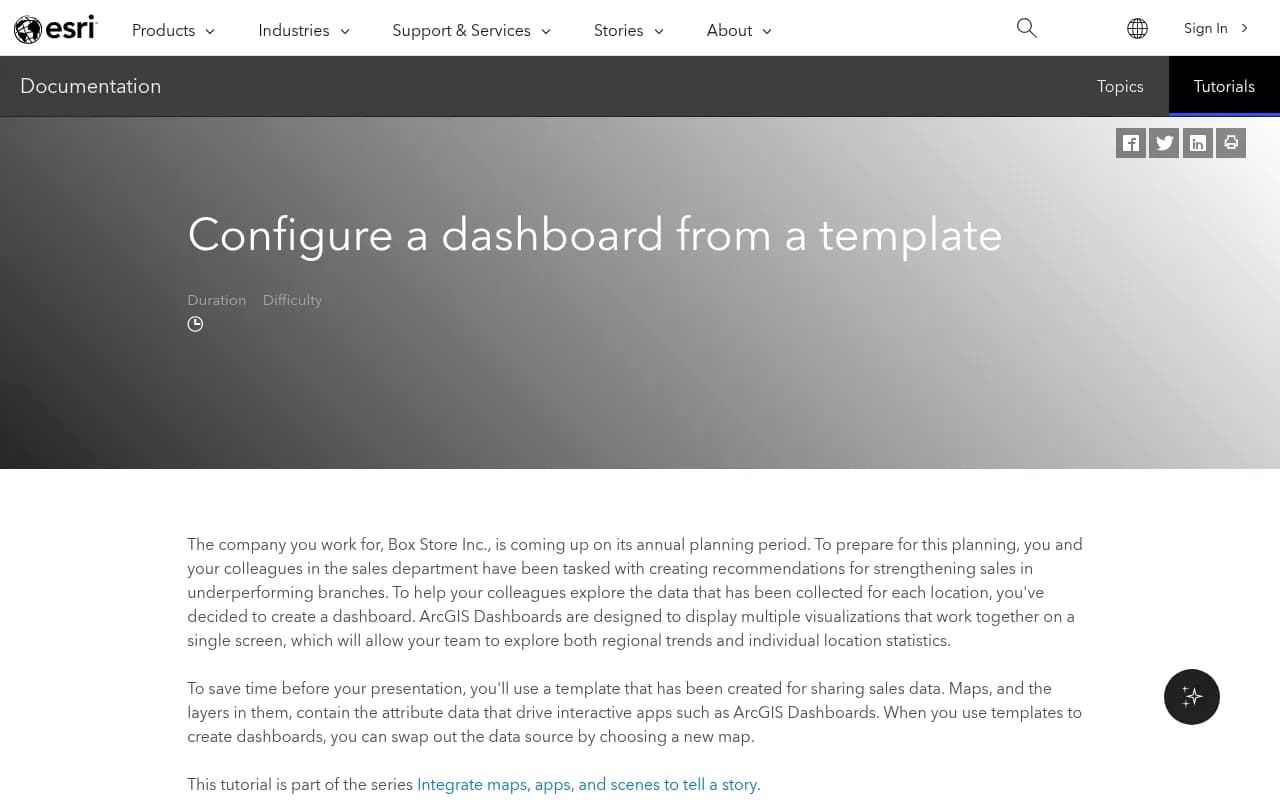
The ArcGIS tutorial above is about retail sales maps, not AI search. It is still a clean example of a dashboard built from five indicators, two charts, two lists, a details pane and a map. That ratio, a few indicators on top and a handful of charts and lists below, is a good shape for a GEO board too.
Step 3: Start from a template, then swap the data
The ArcGIS walkthrough, last tested in August 2026, shows the pattern that saves the most time. You open an existing dashboard that fits your audience, then swap the underlying data source. The widgets keep their layout and you only repoint them.
The same idea works for GEO. Rather than designing from scratch, start from a template that already has the structure:
- Competitor comparison: share of voice, visibility score and position side by side for you and the competitors you track.
- Topic gaps: which topics AI answers cover where your pages are absent or weak.
- AI model breakdown: visibility and citations per model, so you see which engine drives results.
- Citations: top cited domains, top cited URLs and content types.
Promptwatch ships dashboard templates along these lines (competitor comparison, topic gaps, AI model breakdown, citations). You can start from one, then reorder or remove widgets, and save it as a team or personal dashboard.
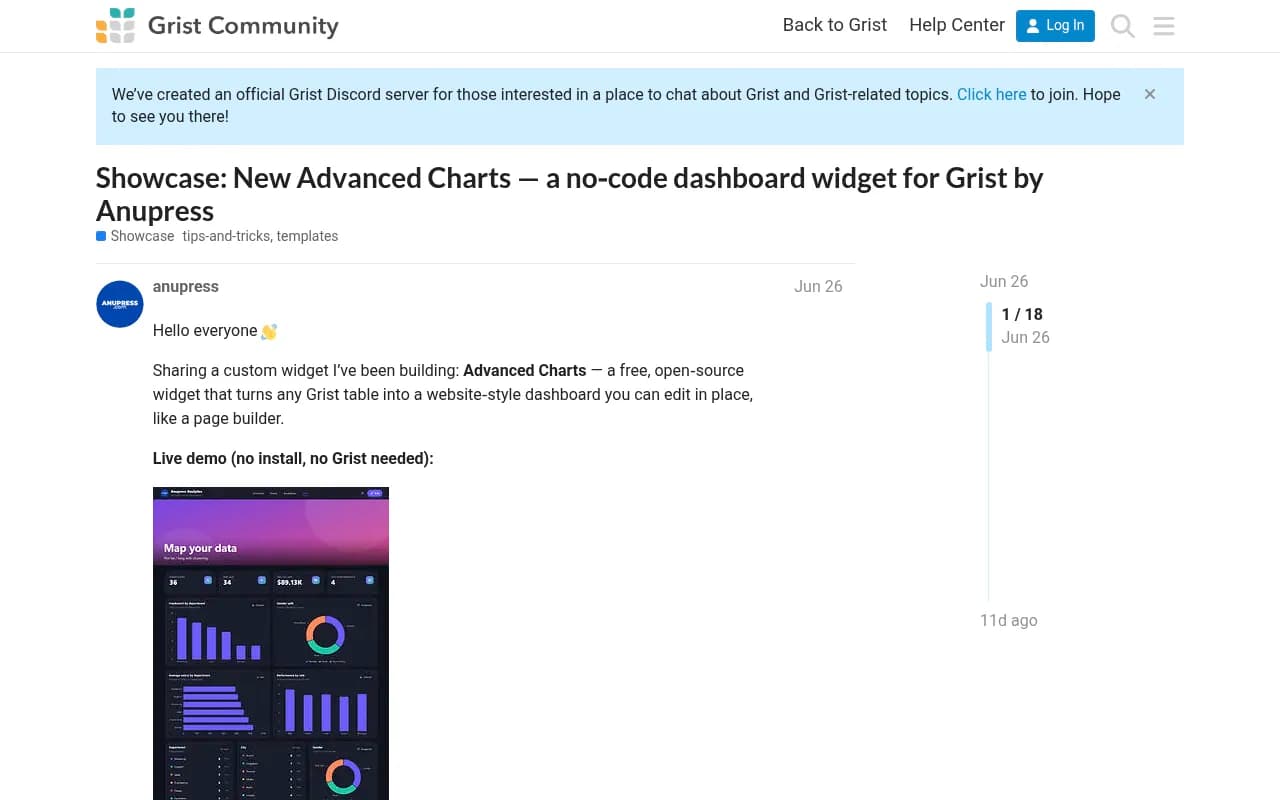
If you prefer a general-purpose builder, community widgets can fill gaps. The Grist community has a free open-source Advanced Charts widget that turns a table into richer charts without code. It is a reminder that if your GEO data is exported to a spreadsheet or database, you can still chart it well.
What to cut from a template
Templates arrive with everything. Delete anything that does not feed your Step 1 decision. My rule: if nobody has acted on a widget in a month, it goes. You can always add it back.
Step 4: Segment by prompt intent and content type
This is the step most people skip, and it changes what you see. Blended totals hide the interesting differences.
Promptwatch's ChatGPT citation share by content type report (Sep 28 to Oct 4, 2026) shows how much the mix shifts with intent:
| Prompt intent | Product pages | Landing pages | Listicles | Notable extra |
|---|---|---|---|---|
| Commercial | 26.0% | 20.6% | 15.0% | Comparisons 7.9% |
| Informational | 19.1% | 13.9% | 13.6% | How-tos 10.7%, docs 8.5% |
| Branded | 23.3% | 22.8% | n/a | Reviews 5.6%, FAQ 4.8% |
Overall, product pages hold 22.4% of classified ChatGPT citations and landing pages 16.8%. Editorial formats combined make up about 43%.
What does that mean for your widgets? If you only chart total citations, a new how-to guide that earns citations on informational prompts looks like noise next to product page volume. Split the chart. One widget for commercial prompts, one for informational, one for branded. Within each, break out content type.
A practical layout:
- A filter bar at the top for prompt type (organic, brand-specific, competitor comparison), country and model.
- A stacked bar of citations by content type, repeated per intent.
- A table of your top cited URLs with content type as a column.
Topics, tags and personas add a second segmentation axis. Use them when your prompt set is large enough that intent alone leaves piles of prompts in one bucket.
Step 5: Set up the A/B period chart
The A/B period chart compares two time windows on the same metric, for example the 28 days before a content refresh against the 28 days after. It is the single most useful widget for proving that work paid off. It is also the easiest one to misread.
Pick periods that are long enough
Citations do not decay evenly. Promptwatch's content half-life report tracked pages ChatGPT cited on July 6, 2026 for 90 days. Landing pages and docs stayed cited longest, while news lost half its pages within 36 days.
That has two consequences for your comparison:
- A two-week window on a news-heavy site mostly measures churn, not performance.
- If you compare a period dominated by fresh news pages against one dominated by evergreen pages, the difference is the content type, not your effort.
Four weeks is a reasonable minimum. Eight is safer for evergreen content.
Compare like with like
Build the chart with the same filters on both sides: same monitor, same models, same countries, same prompt intent. If you add 50 prompts between period A and period B, the numbers are not comparable. Freeze the prompt set, or compare share-based metrics such as visibility score and share of voice rather than raw counts.
Read it against the engine baseline
Engines move on their own. Promptwatch's average sources per response data (published Sept 23, 2025) found ChatGPT cites about 5 sources per web-search answer, Google AI Overviews about 10, and Perplexity almost exactly 10 every day. Copilot swung from under 2 to nearly 17 within a few weeks before settling.
So add a small baseline widget: average citations per response per engine. If your citations rose 15% but the engine average rose 20%, you did not win. Perplexity is useful here because its count barely moves, so a change in your pickup there is more likely to be your own content. For Copilot, judge by monthly trends, not weekly snapshots.
There is also a ChatGPT-specific caution. Promptwatch's data shows ChatGPT's average citations per response dropped around the GPT-5.3 rollout on March 4, 2026, and that reddit.com's share of ChatGPT citations fell from about 4% to 0.5% on August 14, 2026. Annotate your chart with events like these. A period that spans one is not a clean test.
Step 6: Add the layers that explain the numbers
Citation counts tell you what happened. These widgets tell you why.
- Crawler activity: IP-verified AI crawler logs show whether bots reach your pages and hit errors. A cited-page drop with a spike in crawl errors is a technical problem, not a content one.
- Visitor analytics: AI-referred sessions and conversions. This keeps leadership interested, because mentions alone do not pay bills.
- Search Console and Bing data per page: use it to find pages that rank in Google but never get cited by AI.
- Sentiment: a trend line plus a weekly summary. Mentions with weak sentiment are a reputation issue.
Read the metrics together. Low share of voice points to a coverage problem. Late position is prominence. Mentions without self-citations suggest a content or crawlability issue.
Search Console is the free source for the Google side of this.
Step 7: Lay it out and schedule it
Order matters. Put the answer to the Step 1 question at the top left, where eyes land first.
- Row one: four or five headline indicators.
- Row two: the A/B period chart, full width.
- Row three: segmented content type charts by intent.
- Row four: tables for top cited URLs, domains and prompts.
- Bottom: crawler and traffic widgets.
Then automate delivery. Scheduled PDF reports of a dashboard, white-labeled if you are an agency, mean nobody has to remember to open it. If your platform has a conversational analyst, an agent that can build or edit a dashboard on request is faster than dragging widgets, for example asking it to add a competitor sentiment heatmap by topic.
Tool options for building the dashboard
| Option | Best for | Trade-off |
|---|---|---|
| Promptwatch | Custom dashboards on live GEO data with templates, widgets and an A/B period chart | Tied to its own dataset |
| Looker Studio | Blending GEO exports with Search Console and analytics | You maintain the pipeline |
| Retool | Internal tools with custom logic over APIs | Needs developer time |
| Grist with a chart widget | Lightweight, spreadsheet-style boards | Manual data loading |
| AgencyAnalytics | Client reporting across SEO channels | Less GEO-specific depth |

I would use the platform's own builder first. Exporting data to build the same charts elsewhere is a maintenance burden that most teams underestimate. If you want to compare alternatives before committing, the directory at bestgeosoftware.com lists GEO platforms side by side.
Common mistakes
- Too many widgets. Past about a dozen, people stop reading.
- Mixing intents in one chart, so the signal vanishes.
- Short A/B windows that capture decay rather than change.
- Changing the prompt set mid-comparison.
- Ignoring engine-wide shifts and crediting yourself for them.
- No annotations. Six months later nobody remembers why the line jumped.
A quick build checklist
- Write the audience and the decision.
- Pick a template and swap in your data.
- Delete widgets nobody uses.
- Add intent and content type filters.
- Add the A/B period chart with matched filters and 4+ week windows.
- Add the engine baseline widget.
- Add crawler and traffic layers.
- Annotate known events and schedule the report.
That is a dashboard you can defend in a meeting. The next time someone asks whether the content refresh worked, you open the A/B chart, show two matched periods, point at the baseline, and answer in one minute.