Key takeaways
- A heatmap cell is a ratio, not a fact. Check the denominator (prompts, responses, citation slots) before you trust the color.
- Model columns are not directly comparable. ChatGPT, AI Overviews and Perplexity cite different numbers of sources and pull from different source mixes.
- A sudden color shift across a whole column usually means the platform changed, not your content.
- Country and topic rows with few prompts produce noisy cells. Look at sample size first and trend second.
- Treat every heatmap as a list of questions to investigate, then confirm with a second source such as crawler logs or visitor analytics.
Why heatmaps are easy to misread
Heatmaps were built for website analytics. Siteimprove describes the classic version as a semi-transparent overlay where colors run from blue (low activity) to red (high activity) so you can see which parts of a page get attention. The idea carries over neatly to AI visibility: swap the page for a grid of brands, models, topics or countries, and swap clicks for visibility, share of voice, position or sentiment.
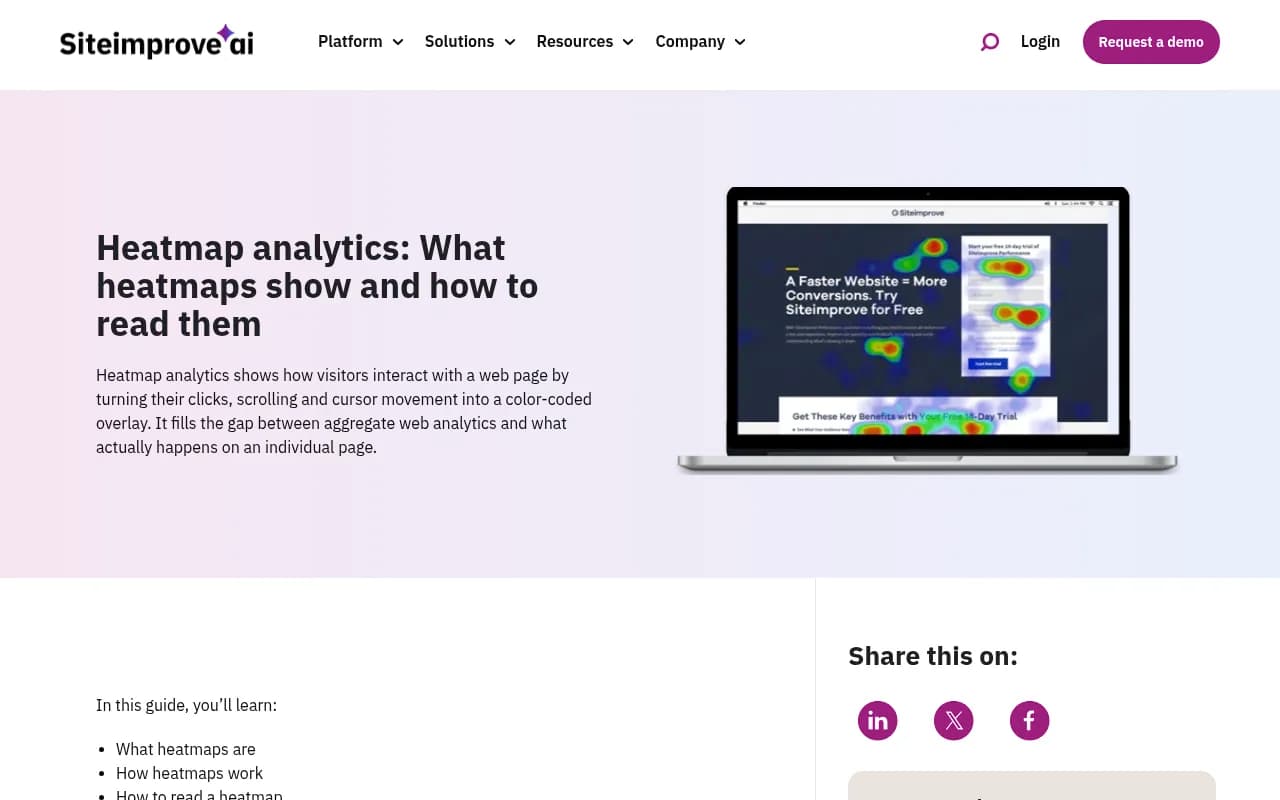
The problem is the same in both worlds. A color gradient makes a number feel like a conclusion. Plerdy frames the whole topic as learning to read heatmaps without fooling yourself, and that is the right attitude. Red does not mean good. Blue does not mean broken. It means a number is higher or lower than the other numbers on the same scale, and the scale was chosen by someone (usually the software).
I have watched teams celebrate a red cell that came from 4 prompts and panic over a blue column that came from a platform update. Both mistakes are avoidable with a short checklist.
What a visibility heatmap actually compares
In AI search tracking, a heatmap takes any two dimensions and plots one metric across them. Common pairings:
- Brands by models: who shows up where
- Brands by topics: which subject areas you own and which you do not
- Brands by countries: where your visibility is strong or absent
- Topics by countries: where a theme is covered in one market and ignored in another
The metric inside each cell is usually one of four things: visibility score, share of voice, average position in the answer, or sentiment. They answer different questions, so a heatmap on one metric should not be read as if it were another.
| Metric in the cell | What high means | What it can hide |
|---|---|---|
| Visibility score | You appear often and prominently | Appearing in low-value prompts |
| Share of voice | You take a large slice of mentions | A tiny total pool of mentions |
| Position | You are named early | Few answers with a ranked list |
| Sentiment | Tone around you is positive | Neutral is about 50 on a 0-100 scale, so 55 is not praise |
Picking the metric first, before looking at colors, keeps you from retrofitting a story onto whatever lit up.
Step 1: Check the color scale and the denominator
The Atlassian guide on heatmaps notes that a heatmap is built from a table of values bucketed by two categories. Before you read anything, find out what the table underneath looks like.
Ask these questions:
- Is the color scale fixed (0 to 100) or relative to the min and max in this view? A relative scale makes the best cell red even if the best cell is mediocre.
- Is each row or column normalized? If every row is scaled to its own maximum, you cannot compare rows.
- What is the denominator? Percent of prompts, percent of responses, or percent of citation slots?
- How many observations sit behind each cell?
If the tool lets you hover to see counts, do it. If it does not, export the data. Export-ready tables are one reason to prefer platforms that give you CSV or Excel output of prompts, responses and citations. It is much harder to fool yourself with a spreadsheet next to the chart.
Step 2: Compare models per slot, not per raw count
The model dimension is where most misreading happens, because models do not give you the same number of places to appear.
Promptwatch Data's average sources per response report shows how different the engines are. ChatGPT cites about 5 sources per web-search answer, and that only covers messages where search was triggered. Google AI Overviews cites about 10, roughly double. Perplexity sits almost exactly at 10 every day, which Promptwatch calls a stable test bench for GEO changes. Copilot swung from under 2 to nearly 17 sources within a few weeks before settling at the low end, so weekly snapshots of Copilot are close to useless and monthly trends are the right unit.
What this means for a heatmap:
- If you appear in 30% of Perplexity answers and 30% of ChatGPT answers, the two cells are the same color but not the same achievement. Perplexity has twice the slots to fill.
- A brand that looks weaker in ChatGPT than in AI Overviews may simply be competing for half as many places.
- Copilot cells deserve a wider time window than the others.
The fix is to read each model column against its own baseline, and where possible look at citations per response alongside visibility.
The source mix differs too
Even with equal slots, the engines pull from different places. In Promptwatch's social media citations by AI model report for Sep 28 to Oct 4, 2026, social platforms made up 0.46% of ChatGPT citations but 12.2% of Google AI Overviews citations, about 26 times as much. Perplexity landed at 2.7%. Inside AI Overviews, YouTube was 4.28%, Facebook 2.38% and Reddit 2.15%. TikTok showed up only in AI Overviews.
So a brand whose strength is YouTube and Reddit presence will glow in one column and look dead in another, and that is not a content problem. The cross-engine averages in that report (YouTube 1.70%, Reddit 1.03%) hide exactly this. Averaging a heatmap row across models is almost always a mistake.
Step 3: Watch for column-wide shifts
If an entire model column changes color overnight, suspect the platform before your own work. Three examples from Promptwatch Data:
- GPT-5.3 rolled out on March 4, 2026. ChatGPT went from about 6.4 cited sources per search-enabled response to about 4.7 to 4.9 by late March, roughly 27% fewer slots, and it did not recover. GPT-5.3, GPT-5.4 and GPT-5-Mini all dropped within about a day. See the ChatGPT citation drop report.
- On August 14, 2026, reddit.com's share of ChatGPT citations fell from about 4% to 0.5%, per the Reddit citations report. Any brand whose ChatGPT visibility leaned on Reddit threads would have seen a color change that day.
- On August 8, 2026, ChatGPT started using the site: operator at scale, going from about 0.4% to about 17% of fan-out queries overnight, according to the site: operator report. Fan-out behavior changes what gets retrieved, which changes who gets cited.
Promptwatch's own advice on the March drop is simple: check the date against model releases before blaming your content, and track citations per response so that "we lost visibility" can be separated from "ChatGPT cites fewer sources overall." Single-snapshot audits are unreliable for the same reason.
A practical test: if every brand in the column, including competitors, moved in the same direction on the same day, it is the platform. If only you moved, look at your own pages.
Step 4: Treat topic rows as samples
Topic visibility heatmaps are built from the prompts you chose to track. That makes them only as good as the prompt set.
Things that quietly distort a topic row:
- Unequal prompt counts. A topic with 6 prompts swings wildly from one answer. A topic with 60 does not.
- Prompt type mix. Brand-specific prompts ("is Brand X good") flatter you. Organic and competitor-comparison prompts are harder. A topic stuffed with branded prompts will look red for no real reason.
- Prompts nobody asks. Visibility on a prompt with no volume is a vanity cell. Volume and difficulty scores, where your tool provides them, tell you which red cells matter.
- Industry source patterns. ChatGPT's top cited sites differ by vertical. For software prompts, GitHub, Microsoft's docs and G2 lead (software report). For travel, Skyscanner, Going and Tripadvisor lead (travel report). In healthcare, government and public health sites earn almost half (healthcare report). A blue cell in healthcare may be structural, because the engine favors institutions over brands.
If a topic looks cold, ask whether it is cold because you lack content or because the engine mostly cites a source type you can never be.
Step 5: Read country cells with locale in mind
Country heatmaps are the easiest to over-read. A few specific traps:
- Small samples. One market with a handful of prompts will flicker. Wait for a trend.
- Language mismatch. A prompt tracked in English for a Dutch market is a different test from the same question in Dutch. Make sure the prompt language matches the country.
- Surface differences. AI Overviews are region-specific, so a country cell for Google surfaces and one for ChatGPT are measuring different systems.
- Local intent. For near-me queries, the country is too coarse. Checks pinned to a city or exact coordinates give a more honest view for multi-location brands.
- Competitor set. The brands that matter in Germany may not be the ones that matter in the US. A country column compared against the wrong competitors reads as a problem that is not there.
I will say the obvious thing here: I could not find solid public data on how much country-to-country variation is normal in AI answers, so do not assume a 10-point gap between markets means anything until you have watched it for a few weeks.
Step 6: Separate the problem type
Once you trust a cell, diagnose it. Different heatmap patterns point at different fixes.
| Pattern | Likely problem | First thing to check |
|---|---|---|
| Low share of voice across many topics | Coverage | Content gap analysis against tracked prompts |
| Mentioned but late in the answer | Prominence | Comparison and listicle pages, third-party mentions |
| Mentioned but never cited as a source | Content or crawlability | Crawler logs, robots rules, page structure |
| Weak sentiment on one model | Reputation | The cited sources shaping the answer |
| One country cold, others warm | Localization | Language, local sources, hreflang, local competitors |
| Whole column shifted | Platform change | Release dates and competitor movement |
Heatmaps tell you where to look. They rarely tell you why.
Step 7: Confirm with a second source
Never act on a heatmap alone. Cross-check with data that does not come from the same prompt panel:
- Crawler logs show whether AI bots even fetch the page you want cited.
- Visitor analytics show whether AI-referred traffic moved, which is the thing you care about.
- Search Console data shows whether the pages rank in Google but never get cited by AI.
- A manual spot check of the real interface for the prompts behind the cell.
User-facing answers can differ from API outputs, so a tool that monitors the actual interfaces is a better basis for a heatmap than one that only calls APIs. Promptwatch tracks the real UIs, lets you build brand, model, topic and country heatmaps on visibility, sentiment, position or share of voice, and puts crawler logs and AI traffic next to them for the cross-check.
Tools that produce these heatmaps
Most AI visibility platforms offer some version of a grid view. They differ in how much underlying data you can see.
| Tool | Heatmap-style views | Cross-check data available |
|---|---|---|
| Promptwatch | Any two dimensions (brands, models, topics, countries) on four metrics | Crawler logs, visitor analytics, Search Console |
| Profound | Competitive visibility views | Mostly monitoring |
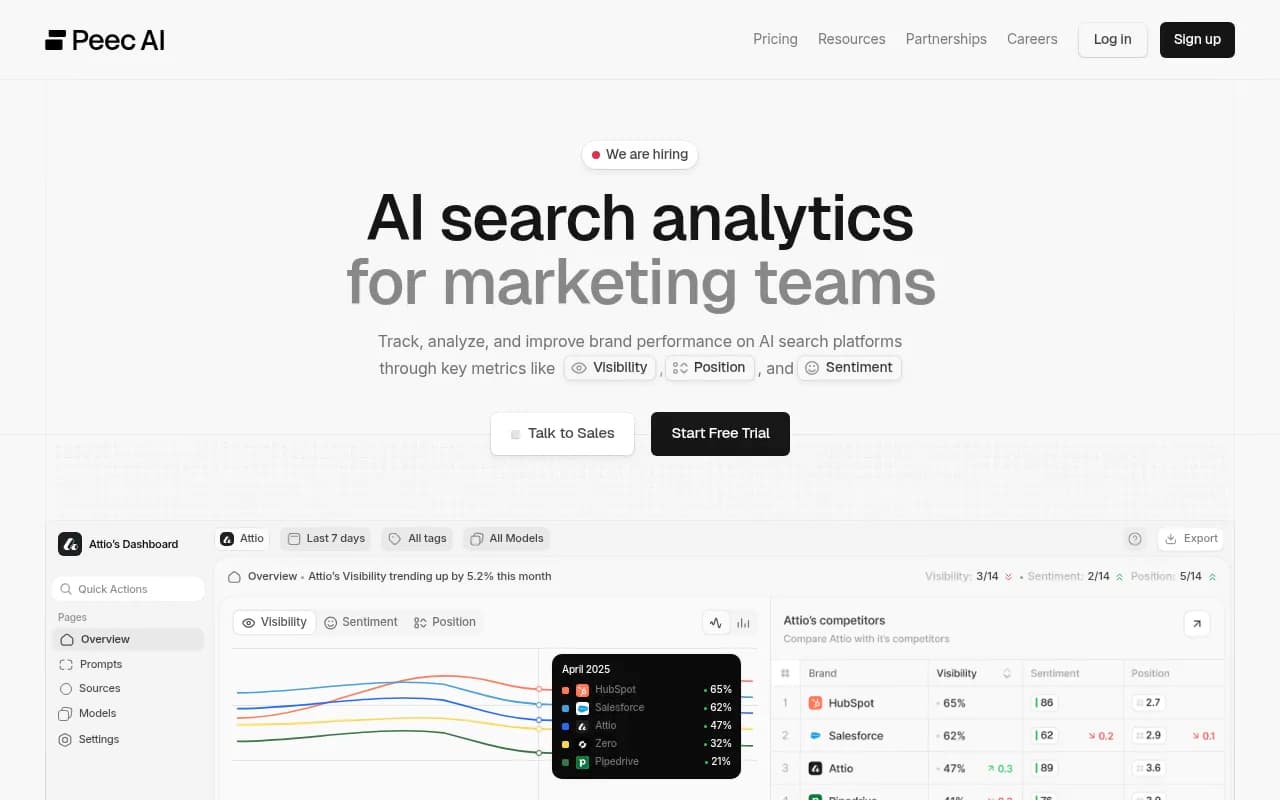
| Peec AI | Prompt-level tracking | Limited |
| Otterly.AI | Prompt tracking and reports | Limited |
| Semrush | AI visibility inside an SEO suite | Traditional SEO data |
For a wider survey of options, the GEO software directory lists more tools by category.
A pre-flight checklist before you share a heatmap
- State the metric and the period in the title of the chart.
- Show the sample size (prompts and responses) next to each row and column.
- Use a fixed color scale if you will compare charts over time.
- Do not average across models.
- Mark known platform change dates on the timeline.
- Compare weeks of data, not days. Use months for volatile surfaces like Copilot.
- Pick one action per red or blue cell, and confirm it with a second data source.
Frequently asked questions
Is a red cell always good?
No. Red means high on the scale in use. With a relative scale, the top cell is red even when it is poor. With sentiment, a score near 50 is neutral, so mild green is not a compliment.
How many prompts do I need per cell?
There is no universal number, and I would distrust anyone who gives you one. As a rule of thumb, if one answer flipping would change the color, the cell is too thin to act on.
Why did my whole ChatGPT column go blue?
Check whether competitors moved too and whether a model release or retrieval change happened that week. The March 2026 GPT-5.3 rollout cut ChatGPT's cited sources by about 27% and nobody's content changed.
Can I compare Perplexity and ChatGPT in one chart?
Yes, but compare each against its own baseline, since Perplexity gives about 10 slots to ChatGPT's roughly 5.
The short version
Before you read the colors, read the table behind them: metric, denominator, sample size, slots per model, date. Then check whether the shift is column-wide, which points to the platform, or cell-specific, which points to you. If you do only that, you will avoid most of the bad decisions that heatmaps invite.