Key takeaways
- Logpush is the no-code, no-per-request-cost option. Vendors like Profound and AirOps describe it as an Enterprise feature, while Cloudflare's own docs list availability across plans, so check the live docs for the HTTP requests dataset on your plan before you commit.
- A Worker works on any plan but runs on every request, so it adds Workers request and CPU charges and code you have to maintain.
- A WordPress plugin is the simplest route for WordPress sites, but it only sees what reaches PHP. Heavy CDN or page caching means it misses requests.
- Whatever you choose, the data has to be IP-verified and include user agent, URI, status code, and timestamp. Otherwise spoofed bots pollute your numbers.
- Compare your logs with a public benchmark such as Promptwatch Data. A provider that is large in the benchmark but near zero in your logs usually means you are blocking it.
Why AI crawler logs are worth the setup effort
Analytics scripts do not see crawlers. GPTBot, ClaudeBot and PerplexityBot do not run JavaScript, so Google Analytics shows you nothing. The only place they show up is your server or CDN logs.
That matters because the mix is changing quickly. Promptwatch Data's AI crawler traffic report found OpenAI made up 79.8% of verified AI crawler requests in Aug 31 to Sep 6, 2026, down from 94.8% in Jun 8 to 14, 2026. Other providers are taking share. Separately, Promptwatch Data's Meta-WebIndexer report shows Meta-WebIndexer went from about 2% to nearly 38% of tracked AI crawler requests between mid-July and August 9, 2026. If you are not logging, you will not notice moves like that on your own site.
So the question is not whether to collect logs. It is how to get them to wherever you analyze them. Three paths cover most sites.
The three options at a glance
| Cloudflare Logpush | Cloudflare Worker | WordPress plugin | |
|---|---|---|---|
| Where it runs | Cloudflare edge, managed by Cloudflare | Cloudflare edge, your code | Inside WordPress (PHP) |
| Code to maintain | None | Yes (Worker plus optional Queue) | None, but plugin updates |
| Plan requirement | Vendor docs say Enterprise; Cloudflare docs list broader availability (verify) | Workers Free or Paid | Any host |
| Per-request cost | None from Cloudflare for the Worker, but destination and Logpush usage rates apply | Workers requests and CPU | Server load only |
| Sees cached requests | Yes, it logs at the edge | Yes, if bound to the route | Often no |
| Setup time | Minutes | An hour or more | Minutes |
| Best for | Enterprise or any plan that supports the dataset | Free, Pro and Business plans without Logpush | WordPress sites without Cloudflare |
The short version: use Logpush if your plan allows it, a Worker if it does not, and a plugin if you are on WordPress and not behind a CDN that caches pages.
Option 1: Cloudflare Logpush
Logpush is Cloudflare's native log delivery. It batches request logs and pushes them to a destination such as R2, a SIEM, or an HTTPS endpoint. Cloudflare's Logpush docs describe delivery as batches sent as quickly as possible, with no minimum batch size, and note that you cannot change the push frequency. You can tune batch size through the API if your destination needs it.
For AI crawler analytics you want the zone-level http_requests dataset sent to an HTTPS endpoint. AirOps documents a typical job: a POST to /zones/<ZONE_ID>/logpush/jobs with the dataset set to http_requests, an ingest URL as the destination, and auth passed as a header_X-API-Key= query parameter. The fields they request are worth copying as a baseline:
EdgeStartTimestamp, EdgeEndTimestamp, EdgeResponseStatus,
EdgeResponseBytes, ClientRequestMethod, ClientRequestScheme,
ClientRequestHost, ClientRequestURI, ClientRequestUserAgent,
ClientRequestReferer, ClientCountry, ClientDeviceType
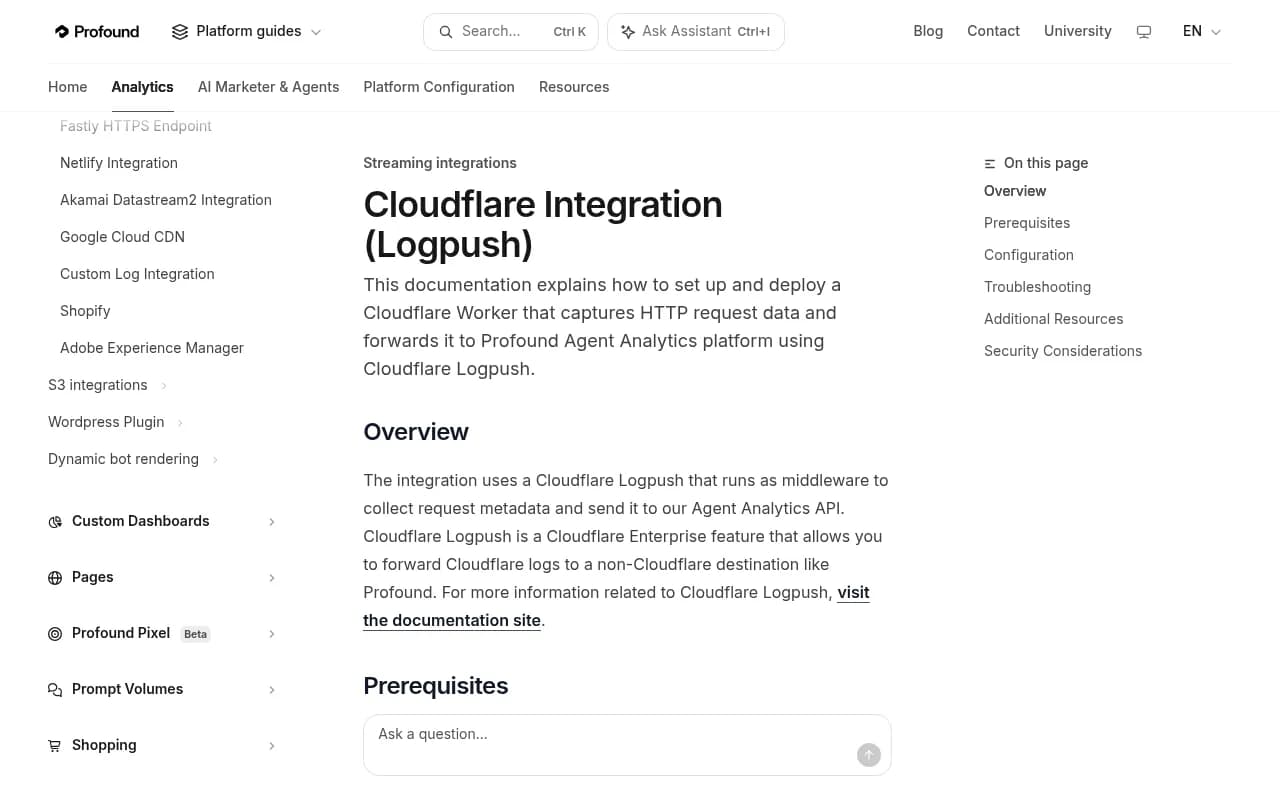
Profound's Logpush setup also asks for ClientIP, which you need if the receiving platform verifies crawlers by IP range. It also tells you to filter on ClientRequestHost so only your domain is sent.
The plan question
This is where sources disagree, so I would not take any one of them at face value. Profound's docs call Logpush a Cloudflare Enterprise feature and send Free and Pro users to its Worker guide. AirOps says the same and recommends Logpush only for Enterprise. Cloudflare's own availability table in the Logpush docs shows "Yes" across Free, Pro, Business and Enterprise, though dataset availability depends on your products and plan. My read: vendors default to the Worker path for non-Enterprise sites because it is guaranteed to work. Check the HTTP requests dataset in your own dashboard under Logpush before assuming either way.
Volume and cost
Logpush usage is measured in uncompressed bytes delivered. Cloudflare's sizing guidance puts an HTTP request record at about 1.5 to 3 kB uncompressed, depending on fields. That works out to roughly 1.5 to 3 GB per day at 1M requests per day, and 15 to 30 GB per day at 10M. Files arrive gzip-compressed, so storage is far smaller. Filter to your domain and consider filtering to known AI user agents if your destination bills by volume. Check the pricing page for current rates.
Pitfalls
- HTTP destination jobs can fail at creation because of destination validation or ownership checks. A Cloudflare Community thread covers this. Test the endpoint first.
- Roles with Logpush access differ from Workers permissions. You need Super Administrator, Administrator, or a Log Share role, or an API token with Logs Edit.
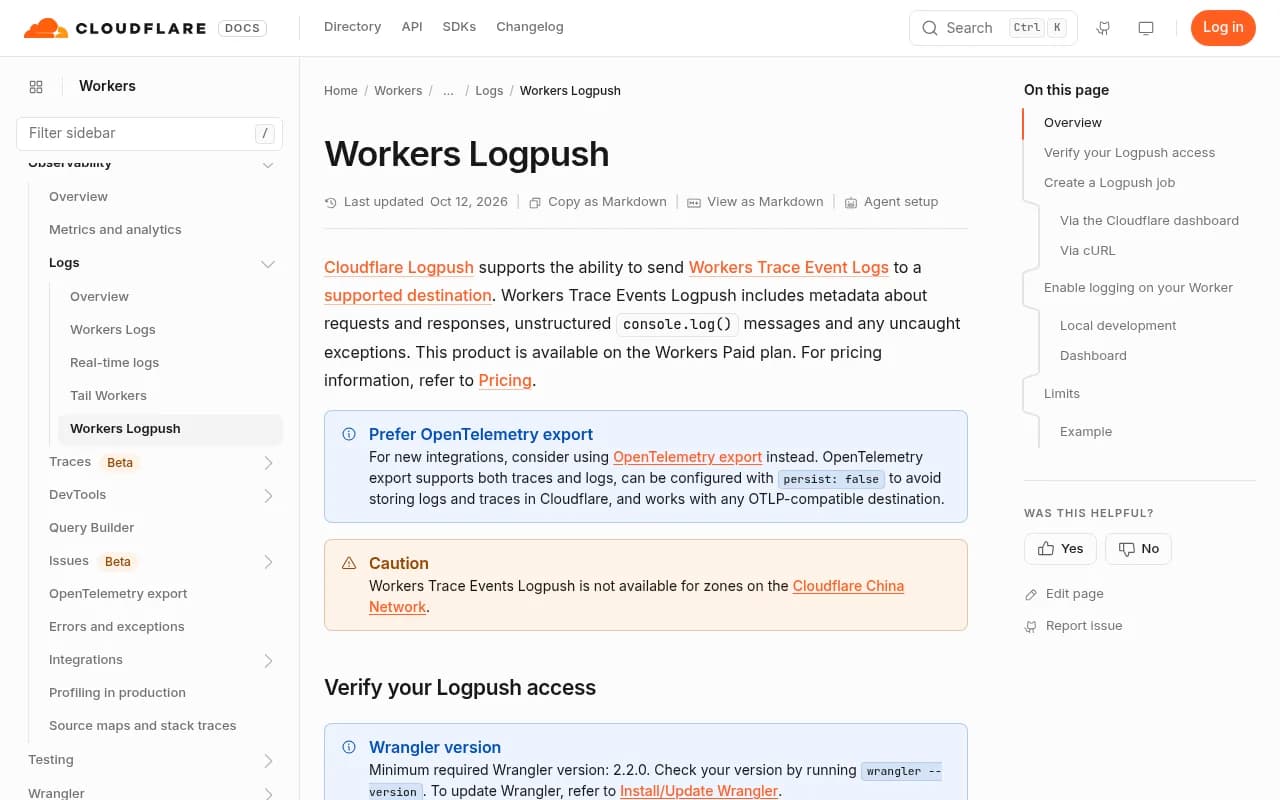
- Do not confuse this with Workers Trace Events Logpush. That is a different, account-scoped dataset (
workers_trace_events) covering Worker invocations, not your site's HTTP traffic.
Option 2: A Cloudflare Worker
A Worker sits on your route, sees each request, and forwards metadata to an ingest endpoint. It is the fallback when Logpush is not available to you, and it works on Free and Pro plans.
AirOps recommends a queue-batching design rather than a naive fetch per request:
- A producer Worker runs on each request, clones the response, and logs metadata using
ctx.waitUntilso it does not slow the visitor. - A Queue consumer picks up messages and POSTs them to the ingest endpoint in batches.
- Their config uses a
max_batch_sizeof 1000 andmax_batch_timeoutof 60 seconds, which keeps traffic under the vendor's rate limit. - The Worker is bound to a route like
example.com/*withzone_nameset to your canonical domain.
What a Worker costs
The catch is that a Worker on your route runs on every request, and Logpush does not. From Cloudflare's Workers pricing page (updated Oct 2, 2026):
- Free: 100,000 requests per day and 10 ms of CPU per invocation.
- Paid: $5/month minimum, 10M requests and 30M CPU-ms included, then $0.30 per extra million requests and $0.02 per extra million CPU-ms.
- Subrequests are not billed, and there is no egress charge.
Cloudflare's worked example: 100M requests a month at 7 ms CPU each costs $45.40 ($5 subscription, $27 requests, $13.40 CPU). That is fine for most sites. But a Free plan Worker on a busy site will hit the 100,000 requests per day cap, and then you have to decide what happens to requests over the cap. Be careful with failure behavior, because a Worker error should never block the page.
Pitfalls
- You own the code. When the vendor changes its payload, you update the Worker. AirOps pins specific Wrangler and compatibility date versions for this reason.
- Over-logging. Skip static assets and images in the Worker, or you will burn requests logging favicons.
- Token handling. Store ingestion tokens as secrets, not in source, and rotate them.
Option 3: A WordPress plugin
If your site runs on WordPress and you do not want to touch a CDN, a plugin that logs requests from inside PHP is the lowest-friction path. Promptwatch lists an official WordPress plugin as one of its crawler log integrations, and Profound documents its own WordPress plugin with a page on CDN caching limitations. I did not test pricing or limits for either, so check current docs.
The tradeoff is visibility:
- Anything served from a page cache or CDN edge never reaches PHP, so it never gets logged. If most of your crawler hits are cache hits, the plugin undercounts.
- Requests blocked upstream by a WAF or bot rule do not show up either, which hides precisely the blocking problems you want to find.
- On busy sites, logging adds load to your origin.
For a small brochure site on shared hosting with no CDN, none of that matters much. For a site behind Cloudflare, a plugin is the wrong layer. Go to the edge instead.
How to choose
You are on Cloudflare and the HTTP requests dataset is available: use Logpush. No code, no per-request Worker bill, and it logs cached and blocked traffic at the edge.
You are on Cloudflare Free, Pro or Business and Logpush is not available: use the Worker with Queue batching. Budget for Workers charges if traffic is high.
You are on WordPress with no CDN or only light caching: use the plugin.
You are not on Cloudflare at all: the same logic applies to other CDNs. Promptwatch lists Fastly, AWS CloudFront, Vercel, Netlify, Akamai, Google Cloud CDN, and a custom HTTP endpoint as supported log sources, and Profound documents most of the same.
Hybrid setups: WordPress behind Cloudflare is common. Pick the edge (Logpush or Worker) and skip the plugin, otherwise you get duplicate counts.
Where the logs go
Picking the pipe is half the job. The other half is a tool that can classify what arrives. Raw logs full of user agent strings are hard to read by hand, and user agents are trivially faked.
Promptwatch takes crawler logs from Cloudflare (Logpush by default, or an auto-deployed Worker, with guided setups for WP Engine, Kinsta, Webflow and Shopify sites behind Cloudflare), CloudFront, Fastly, Vercel, Netlify, Akamai, a custom HTTP endpoint, or its WordPress plugin. It verifies requests against the operators' published IP ranges, filters out spoofed bots, and shows which pages crawlers read, which errors they hit, and whether a crawl led to a citation.
Profound and AirOps also ingest Cloudflare Logpush, if you already use them.

If you want to compare other options, the GEO software directory at bestgeosoftware.com lists more platforms.
Fields and filters that matter
Whichever method you pick, send these at minimum:
| Field | Why you need it |
|---|---|
| Timestamp | Trend lines and crawl-to-citation timing |
| Client IP | IP verification against operator ranges |
| User agent | Identifying the crawler |
| Host and URI | Per-page analysis |
| Status code | Finding 403, 404 and 5xx errors that block crawlers |
| Referer | Spotting AI referral clicks |
| Country | Optional, for regional analysis |
Two filters save money: restrict to your host, and exclude obvious static assets if your analysis only cares about HTML pages. Do not filter by user agent at the source unless you are sure of your list, because new crawlers appear often. For a reference list, see the AI bots directory at promptwatch.com/bots.
Checking it works
- Fetch a page yourself with a crawler user agent, then confirm the request shows up in your destination. Note it will not pass IP verification, which is a good test that spoof filtering works.
- Check for delivery errors in Cloudflare (non-2xx from the destination, or 401/403 from a wrong key).
- Wait. AirOps notes human traffic is not shown in its dashboard and that the first bot rows appear when a crawler next visits, which depends on crawl frequency.
- After a week, compare against the Promptwatch Data crawler benchmark. The report's own advice applies: check robots.txt, CDN and WAF rules for every provider, and remember that provider totals hide the split between training crawlers and answer-time fetchers.
Bottom line
If Logpush is available on your plan, take it. If not, build the queue-batched Worker and watch the bill. Use the WordPress plugin only when there is no CDN in front of the site. Then spend the saved time on what the logs show: the pages crawlers hit but never cite, and the providers that never show up at all.