Key takeaways
- AI perception tracking measures what ChatGPT, Gemini, Perplexity and Google AI Overviews say about a client, not just whether they mention it. The unit of analysis is the claim, not the mention.
- Four metrics carry most client reports: brand presence, citation rate, competitive share of voice and sentiment. Keep classic SEO metrics in a separate view.
- Weekly monitoring plus monthly reporting works. Annotate model changes so clients don't read engine noise as strategy.
- Every report should end with three or so decisions, not more charts. Clients read the first paragraph, the headline numbers and the next steps.
- Baseline one client first, then template the format across the rest of the book.
What AI perception tracking actually is
Most agencies started their AI visibility work by asking one question: was the client mentioned? That is a fine first question and a poor last one. A client can show up in 60% of answers and still be described as "expensive," "missing mobile features" or "a good option for small teams only," when the product changed on all three counts a year ago.
Perception tracking is the second layer. It looks at the language AI uses, how often it repeats, which models say it, and which sources it draws from. If you've done reputation work or brand tracker studies, the idea will feel familiar. The difference is that the "respondent" is a set of language models, and the answers change with retrieval updates, not just with market sentiment.
This matters for agencies because the narrative is something you can influence. Models learn claims from pages: the client's own site, review directories, listicles, forums, videos. Find the page teaching the wrong claim and you have a task. That is a much better deliverable than a score that went down two points.
The metrics to put in a client report
Jasper's agency guide for AI visibility reporting lays out a set of four core metrics that I think is about right. Here is how I'd frame each one for a client, including the question it answers.
| Metric | What it measures | The client question it answers |
|---|---|---|
| Brand presence | How often the brand appears across a fixed prompt set | Are we showing up in relevant answers? |
| Citation rate | How often the client's own content is cited as a source | Is AI using our pages to build answers? |
| Share of voice | The client's slice of brand mentions versus named competitors | Are we gaining or losing ground in the category? |
| Sentiment and narrative | How AI describes the brand and which claims repeat | What happens when we do appear? |
A few notes from practice.
Presence comes first. If the client is barely visible on category and decision prompts, there is no point arguing about tone. Share of voice puts it in context: 30% presence sounds fine until you learn the closest competitor sits at 70%. Break it down by model too, because ChatGPT, Gemini and Perplexity often tell different stories.
Citation rate catches a common trap, which is a brand being mentioned without its own content being used. That usually points at either a crawl access problem or a content gap, and the fix differs.
Keep keyword rankings, backlinks, domain authority and organic sessions in their own view. Mixing them into an AI score muddies what the report is measuring, and clients will ask why "the AI number" moved when only traffic did.
From sentiment score to brand narrative
A single sentiment number is the least useful thing in the report. It tells the client the temperature but not the cause. Narrative reporting breaks the number into the individual claims AI makes, groups the repeated ones, and files them under themes: pricing, features, support, reputation.
Then the rule of thumb from the Jasper material applies: a decline caused by one isolated answer is different from the same criticism showing up repeatedly across models and related prompts. Repetition is the signal. One odd Copilot answer is a footnote. "Lacks an integrations marketplace" appearing in four models across thirty prompts is a roadmap item for your content team.
A workable narrative section has four parts:
- The top positive claims AI makes, with how many models repeat each.
- The top negative or outdated claims, with the same counts.
- A theme score for each of pricing, features, support and reputation, compared with two or three competitors.
- For each wrong or stale claim, the page or source teaching it, and what you'll do about it.
Part four is what separates reporting from consulting. Marking a claim accurate or inaccurate and then tracing it to a source page is the step most dashboards skip.
Where the narrative comes from
Which sources shape the story depends on the engine, and that changes your recommendations. In Promptwatch's social media citations data for Oct 11 to Nov 9, 2026, social platforms made up 13.16% of Google AI Overviews citations, 1.94% of Perplexity's and only 0.64% of ChatGPT's. YouTube alone was 6.71% of AI Overviews citations, more than the other six platforms combined. (The October report covered 7 days and November covers 30, so don't treat the two as a like-for-like trend.)
The practical read: a client's ChatGPT narrative is mostly built from non-social sources, meaning their own site, listicles, guides and comparisons. Their AI Overviews narrative leans more on video and social. If the client's perception problem is on Gemini or AI Overviews, a YouTube plan may beat a blog sprint.
Content type matters as well. Promptwatch Data on ChatGPT content types (Sep 28 to Oct 4, 2026) shows product pages as the most cited type at 22.4%. And according to the content half-life report, news pages lost half their cited pages within 36 days while landing pages and docs lasted longest. So a narrative fix built on a news post decays fast. A fix on a landing page or doc sticks.
Choosing the tool stack
You can build this manually with a spreadsheet, a prompt library and a lot of copy and paste. For one client, fine. For ten, you'll spend your month assembling decks.
The tools fall into three groups.
AI visibility platforms with narrative and agency features
Promptwatch is the one I'd start with for agency work because it covers the full loop: monitoring, tracing sources, acting, and measuring. Its Brand Narrative feature pulls individual claims out of tracked responses, groups repeated ones, shows which models say each and scores themes like pricing, features, support and reputation against competitors. Fact Check lets you mark a claim inaccurate and then finds the pages on the client's site that state it or its opposite. Brand Narrative is on every plan, and Fact Check is on Business, Agency Scale and Enterprise. It also collects data from the real interfaces of ChatGPT, AI Overviews, AI Mode, Gemini, Perplexity and others, which matters because UI answers can differ from API outputs.
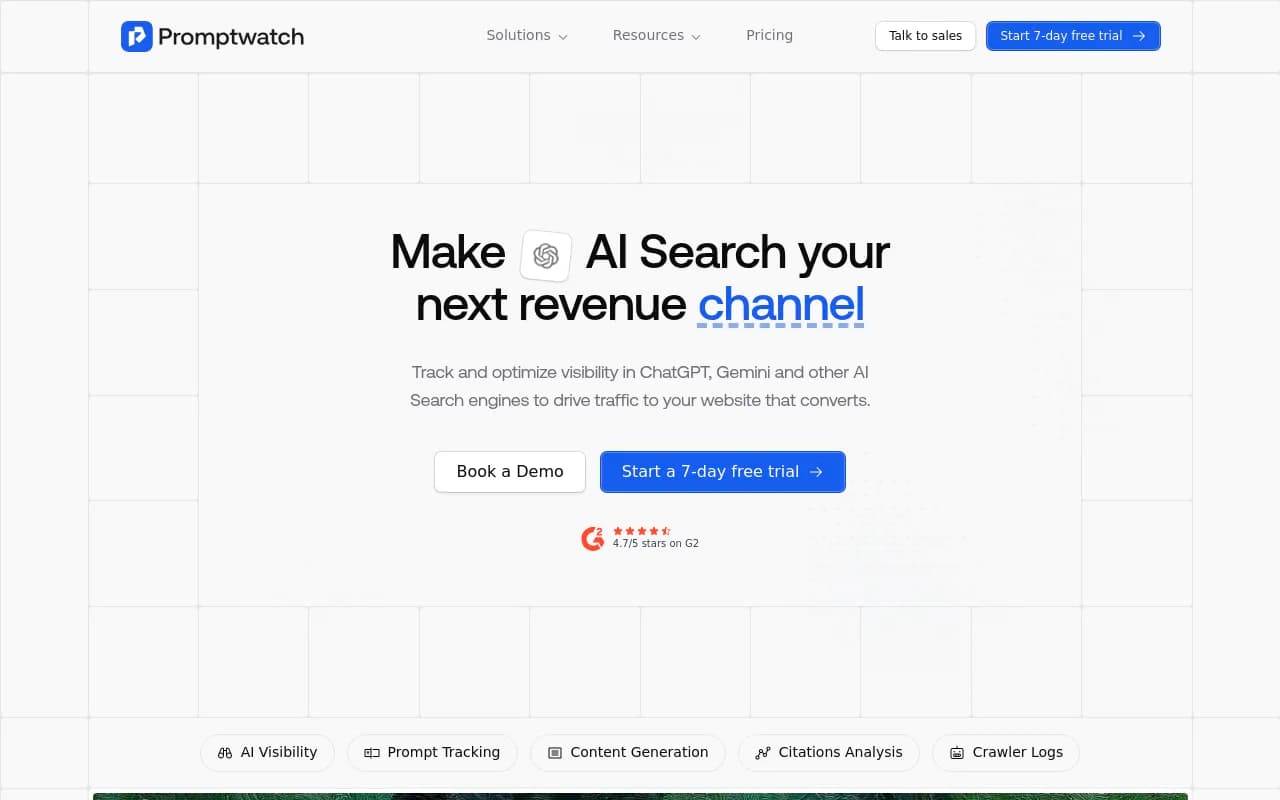
For agencies, the plans are Kick-off at $199/mo, Growth at $399/mo and Scale at $799/mo, with unlimited projects, prompts and seats on all three. Confirm current details at promptwatch.com/pricing. There's a 7-day free trial on monthly billing, and the agency solutions page covers the workflow. One caveat: agency plans don't include the Content Agent or white-label client portal, so agencies that want those go to Enterprise.
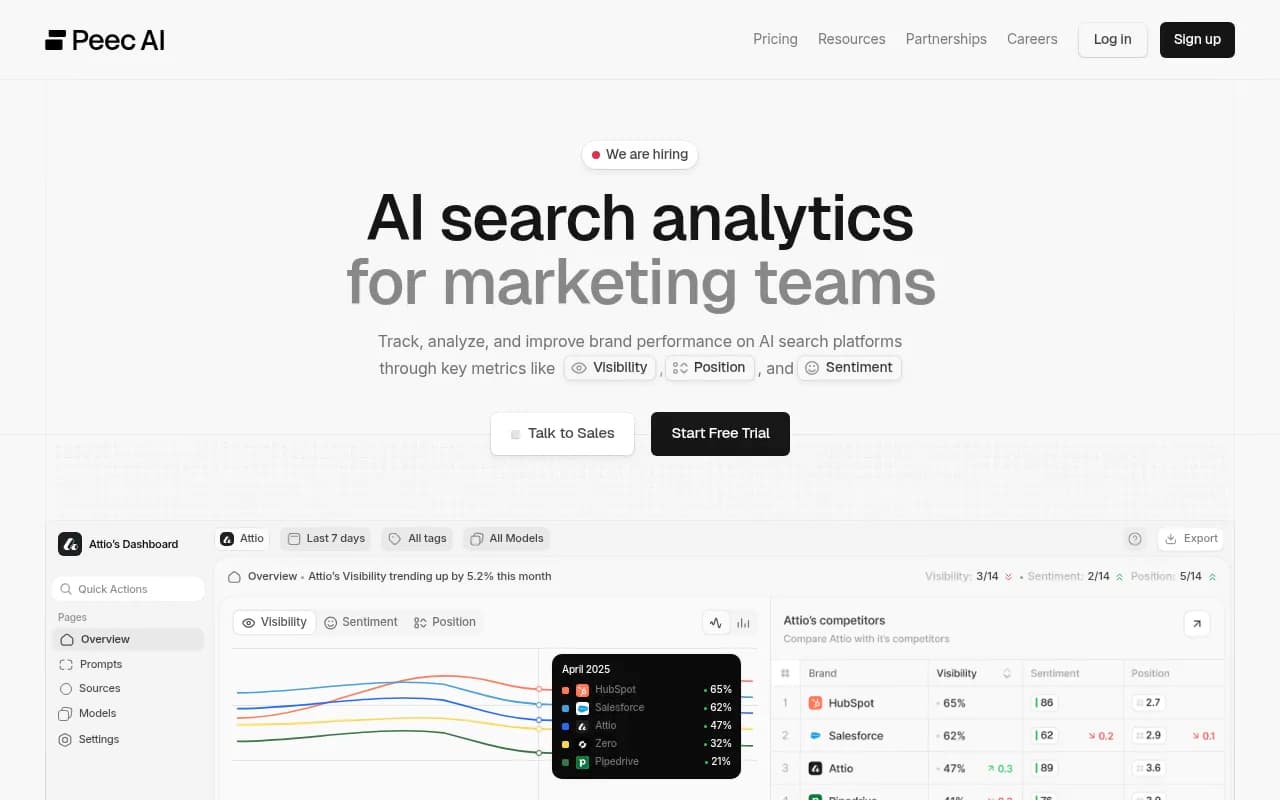
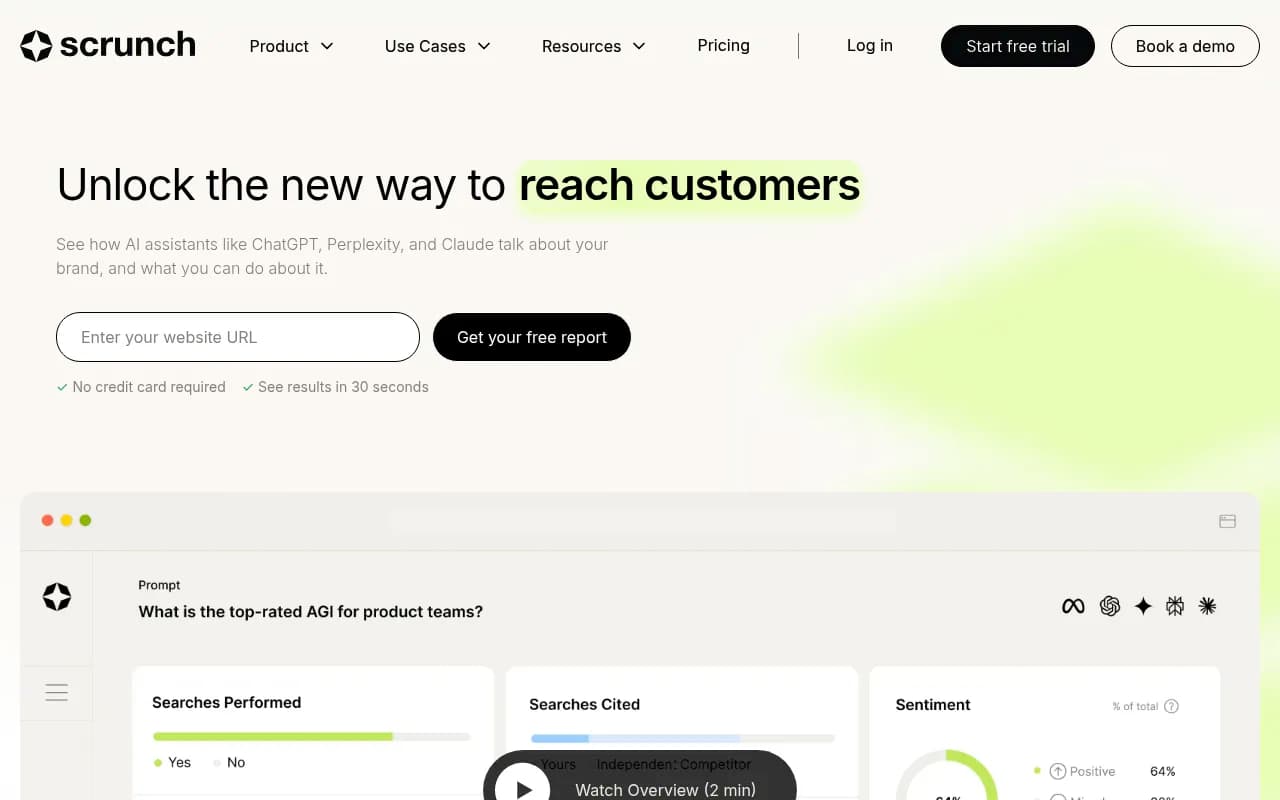
Other options in the same category include Profound, a strong enterprise monitoring product, plus Scrunch, Peec AI and Otterly.AI. Those are mostly monitoring-first. Check the 2026 GEO platform comparison before you commit. For a wider scan, the GEO software directory lists far more.
Agency-built options
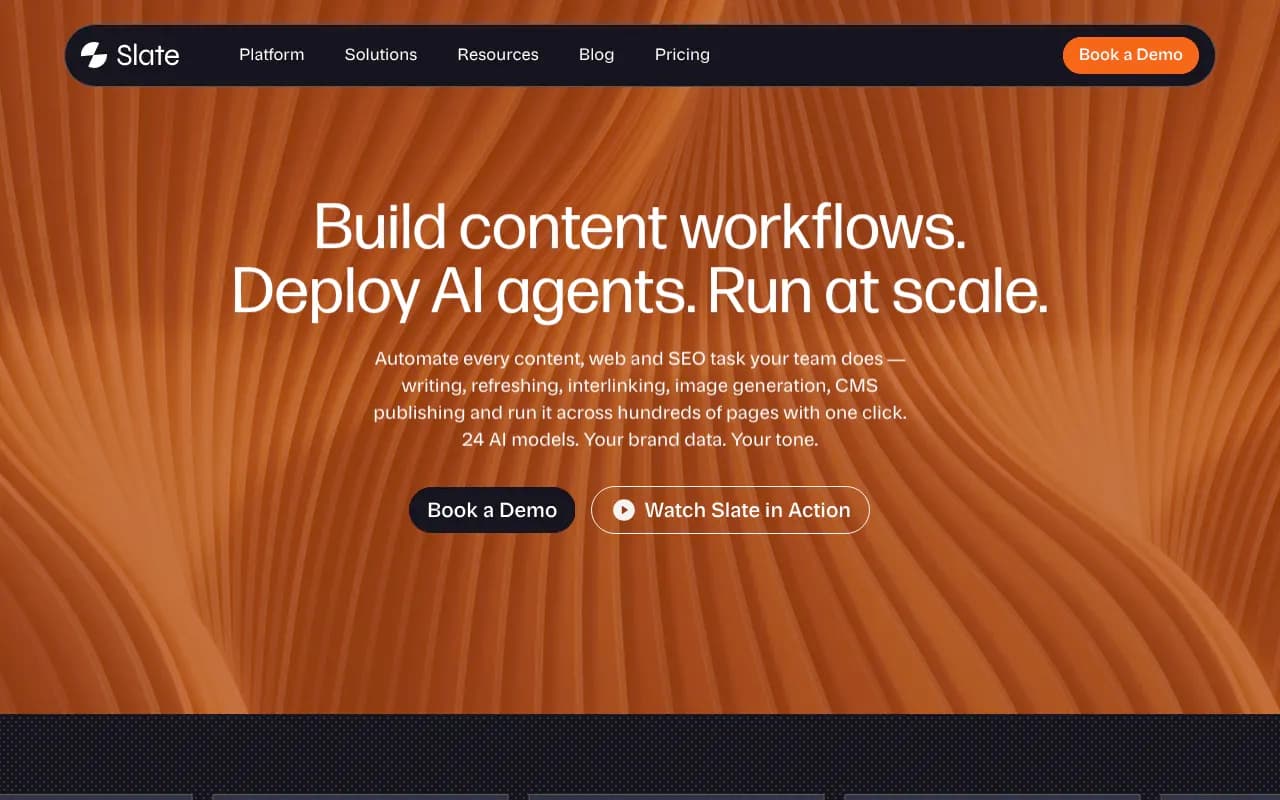
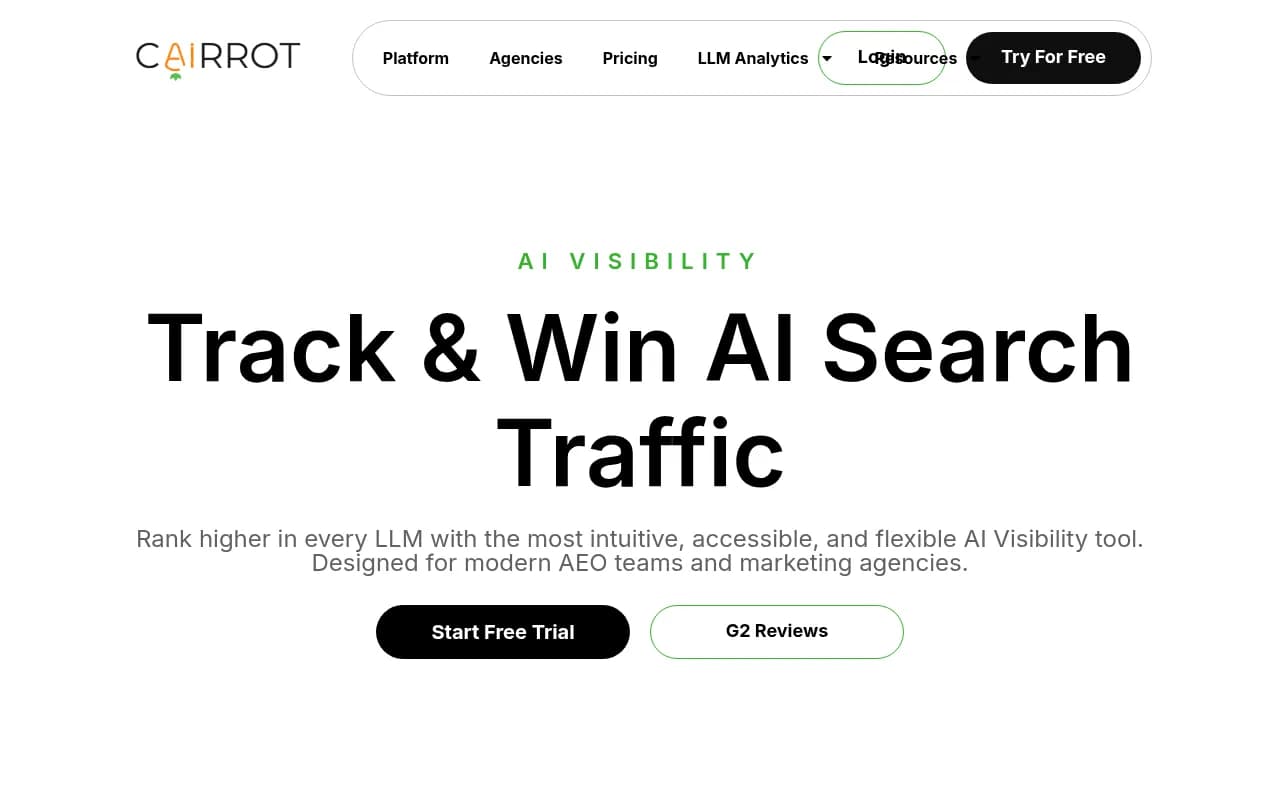
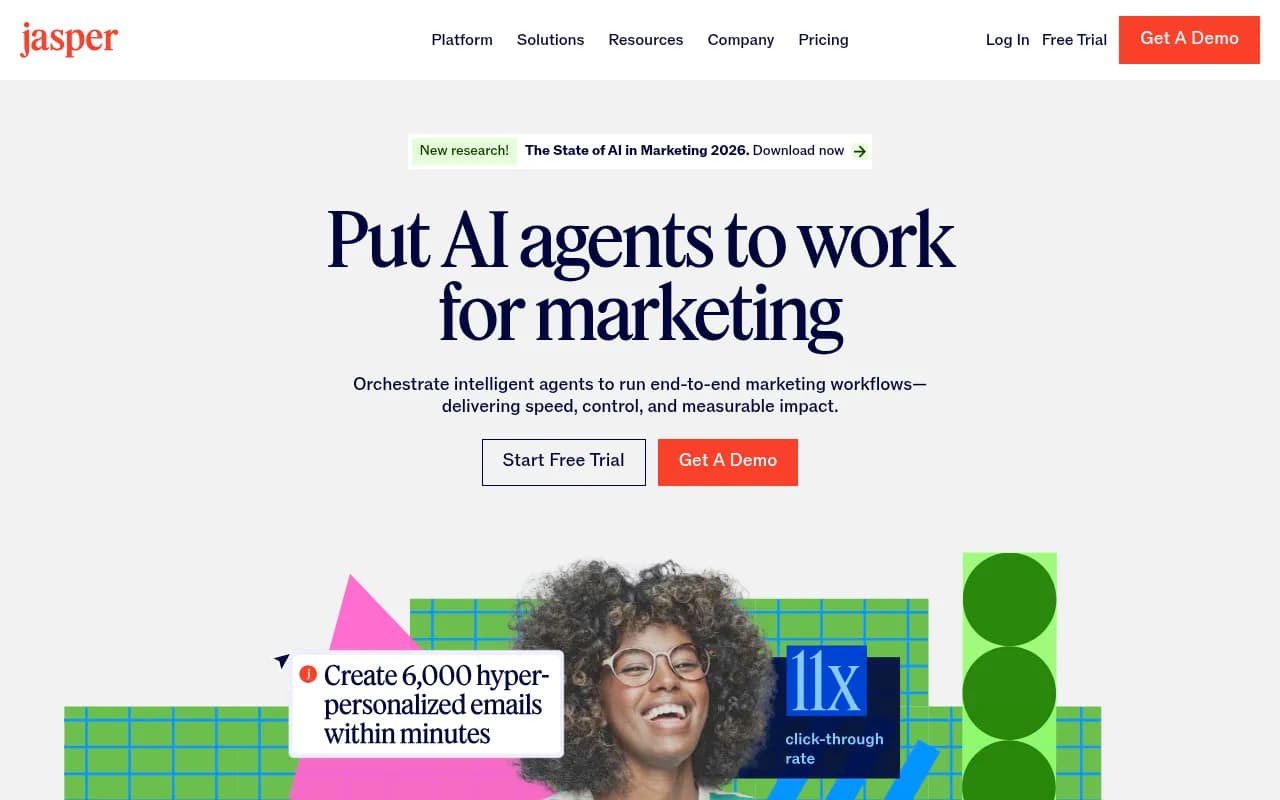
Some tools are built with agencies in mind specifically: Slate, Cairrot and Geneo market to agencies, and Jasper has a GEO capability that automates the visibility layer (presence, citation rate, sentiment, share of voice). I haven't tested these against each other, so treat them as a shortlist to trial, not a recommendation.
Reporting layers
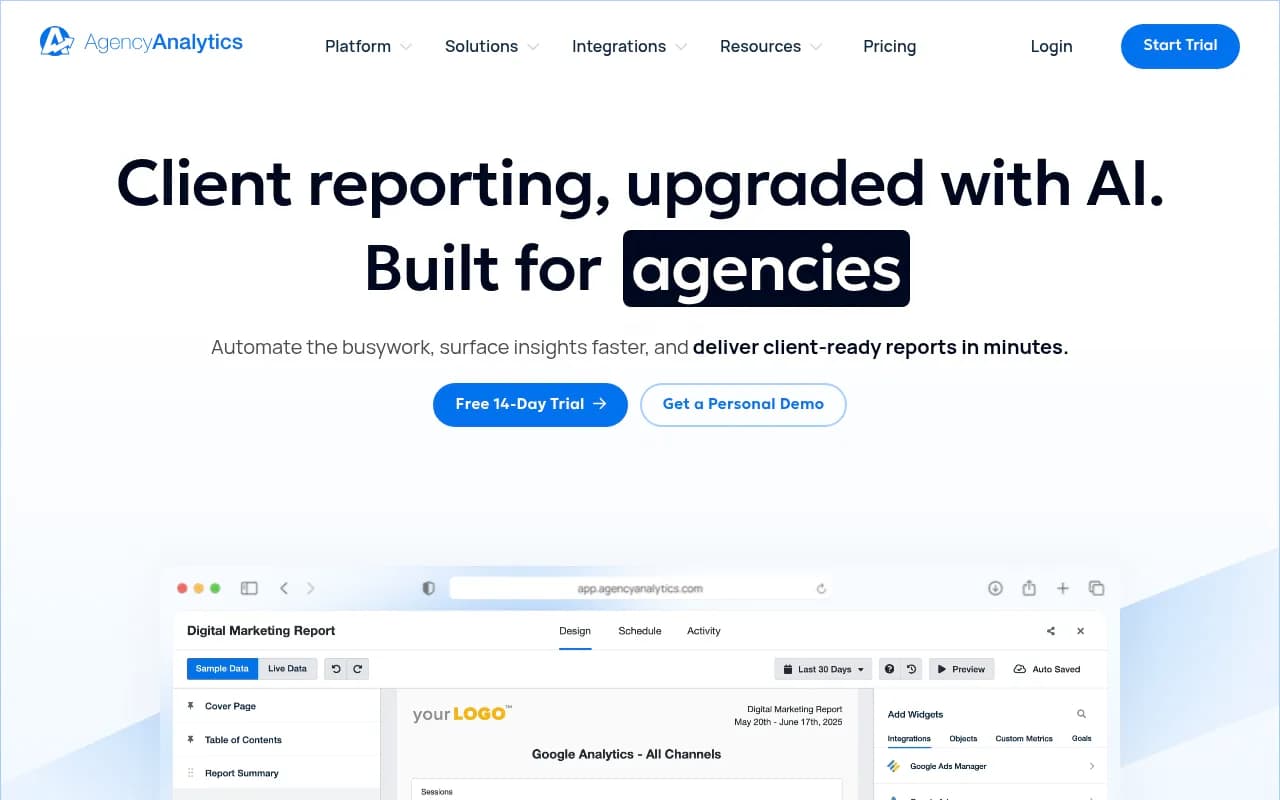
General client reporting tools help with the packaging. AgencyAnalytics has Ask AI and smart reports for its dashboards, and Whatagraph and Supermetrics sit in the same space. They won't produce narrative data themselves, but they can host the AI visibility view next to organic reporting while keeping the two separate.
| Layer | Example tools | Use it for |
|---|---|---|
| AI visibility and narrative | Promptwatch, Profound, Scrunch | Prompts, claims, citations, competitors |
| Agency-focused trackers | Slate, Cairrot, Geneo | Lower-cost multi-client monitoring |
| Reporting wrappers | AgencyAnalytics, Whatagraph | Branded dashboards and scheduled delivery |
| Survey-based brand trackers | GWI, Kantar-style panels | Human perception, as a cross-check |
That last row deserves a note. AI perception is what models say, not what people think. A survey-based tracker answers a different question, and Perspective AI's argument that AI-moderated interviews are replacing $50K tracker studies is about human respondents, not LLM output. For a client with both, report them side by side and never merge them.
Building the prompt library and baseline
The whole report depends on a fixed prompt set. Change the prompts every month and the trend lines are fiction.
- Pick one client where AI visibility already affects the buyer journey.
- Write 30 to 60 prompts across category, comparison, problem-led and branded questions. Include a few written the way a specific buyer persona would phrase them.
- List the competitors the client actually loses deals to, not the ones the client wishes it competed with.
- Decide the measurement rules up front. What counts as a mention? What if the brand name is also a common word? Write it down.
- Run the first audit and call it the baseline.
The first report doesn't need dramatic movement because there is no trend yet. Its job is to show where the brand appears, which competitors have more visibility, how AI describes the client, and which topics to tackle first. From the second report on, you show movement against the same baseline and connect it to work done in the period.
Reporting cadence and noise
Monitor weekly, report monthly. Weekly checks catch sudden drops in visibility, sentiment or competitor presence. Monthly gives enough trend data to avoid arguing about every wobble.
Engines wobble differently, which is where agencies get burned. Promptwatch's average sources data showed ChatGPT citing about 5 sources per web-search answer, Google AI Overviews about 10 and Perplexity almost exactly 10 each day. Copilot's average swung from under 2 to nearly 17 within weeks before settling low. So a change in Perplexity citation pickup is more likely to be your content, while a Copilot swing is more likely a retrieval change on Microsoft's side. Judge Copilot on monthly trends.
Annotate model changes right on the chart. ChatGPT's citations per response dropped around the GPT-5.3 rollout on March 4, 2026, and reddit.com's share of ChatGPT citations fell from roughly 4% to 0.5% on August 14, 2026. A client whose Reddit-driven mentions disappeared that week didn't do anything wrong. Without the annotation you'll spend a call explaining it.
Structuring the client report
Clients skim. In a survey of marketing managers quoted in Storyflow's reporting guide, the unanimous answer was that they read the first paragraph, the headline numbers and the next steps. Build for that.
A one-page layout that works
- Verdict paragraph. Two or three sentences: what changed, why, what we're doing.
- Headline numbers. Presence, citation rate, share of voice, sentiment, each with change versus last month and versus baseline.
- Narrative shift. The two claims that grew, the two that shrank, and any inaccurate claim with its source page.
- Competitor view. A single chart or heatmap by model or topic.
- What we did. Pages published or refreshed, outreach, technical fixes.
- Decisions for next month. Three items, owner and date.
Put deeper tables and prompt-level data in an appendix. And keep the format identical every month. If metrics and visuals change each cycle, the client has to relearn the report before reading it.
Turning findings into recommendations
Use a simple mapping so the report ends with priorities.
| What you see | Likely cause | Recommendation |
|---|---|---|
| Low presence on a valuable topic | Thin content on those buyer questions | Build or expand pages for the topic cluster |
| Mentions but few citations | Crawl access or weak source pages | Check AI crawler access, then strengthen the cited-type pages |
| Share of voice shift | Competitor content on a few prompts | Find the driving prompts, then refresh or differentiate |
| Repeated negative claim | A stale or third-party source | Fix the source page, correct the claim on-site, pursue reviews |
| Single odd answer | Model noise | Log it, watch next cycle |
On the crawler side, tools like Promptwatch's AI crawler logs show whether bots read a page at all, which separates an access problem from a content problem before you spend hours rewriting.
AI-assisted reporting without losing trust
It's tempting to let an AI draft the whole monthly narrative. Supermetrics' agency guide makes the right point: keep a human responsible for the final report. Check that the figures are accurate, the explanation matches the data, recommendations are realistic, the language fits the client, and uncertainty is stated plainly. A confident wrong paragraph in a QBR costs more than a slow one.
Tools such as Agent Chat in Promptwatch can pull the numbers and draft the summary, and scheduled PDF reports can go to the client's inbox automatically. Review the draft before it ships.
Selling it as a service
Once one client's report works, copy the structure across the book and customize prompts, competitors and priorities per account. That turns AI search reporting into a repeatable capability instead of something assembled the night before a QBR.
If you're an in-house team or a smaller shop and don't want to build this capability yourself, an agency partner is another route. 1001 SEO Media runs GEO and AI search work for brands and uses Promptwatch as its AI visibility platform.
To get a feel for the output before you commit, run the free AI visibility report on a client domain. It's a quick way to preview the narrative data you'd be reporting. You can also start the baseline with the 90-day GEO program guide, and see the Promptwatch Data hub for current benchmarks to cite in client decks.
A short checklist
- One prompt library per client, frozen for at least a quarter
- Named competitors agreed with the client
- Four core metrics plus a narrative section
- Model changes annotated on charts
- Verdict paragraph, three decisions, same format every month
- A human reads it before it goes out