Key takeaways
- Report Visibility Score first. It answers the foundational question: does AI name your brand at all, and is that trend moving?
- Add Share of Voice second. It turns an isolated number into a competitive standing, which is what most stakeholders actually want to know.
- Report Position third. Answers are crowded, so being named at all says less than where and how you are named.
- Segment all three by engine, prompt type and topic. A single blended number hides the useful part.
- Definitions vary between tools. Check each vendor's denominator and position rules before you compare numbers.
Why this question comes up
Every AI visibility dashboard now opens with a wall of numbers. Visibility Score, Share of Voice, average position, sentiment, citation share. If you are the person who has to put one of them in front of a CMO or a client on Monday morning, picking the lead metric is a real decision, not a formality.
The three metrics in this guide are the ones most people mix up. They look similar. All three are derived from the same underlying data: a set of tracked prompts, run across a set of AI engines, with the responses parsed for brand mentions. But they answer different questions, and reporting them in the wrong order produces confusing conversations.
Short version: presence first, then competitive standing, then prominence. The rest of this guide explains why, and where each one breaks.
The three metrics in plain terms
| Metric | Question it answers | Absolute or relative | Typical failure mode |
|---|---|---|---|
| Visibility Score | How often does AI name us at all? | Absolute | Reads as good or bad without a competitor reference |
| Share of Voice | How often does AI name us instead of them? | Relative | Moves when the competitor set changes, not when you do |
| Position | Where in the answer do we land? | Relative within an answer | Definition differs by tool; no proven link to clicks |
Visibility Score
Visibility Score is the backbone. In its simplest form, it is the percentage of tracked prompts where your brand shows up. Track 200 prompts, appear in 60, and you sit at 30%. It is the closest AI equivalent to impressions in classic search, and Cognizo's guide to AI visibility metrics calls it the primary KPI for exactly that reason.
There are variations. Some tools count a simple mention rate. Promptwatch scores each response on placement, share of attention and depth, averages those on a 0-100 scale, and counts responses that do not mention you as zero. Both approaches are legitimate. They are not interchangeable, so never compare a score from one tool against a score from another.
Report Visibility Score as a trend, not a snapshot. The direction tells you whether your work is paying off. A single reading tells you almost nothing.
Share of Voice
Share of Voice is your slice of all brand mentions across a tracked prompt set, measured against a defined group of competitors. Ahrefs Brand Radar describes it as the percentage of AI responses within your topic set that mention or cite your brand versus competitors. A 30% Visibility Score reads very differently when the category leader is at 60% than when the leader is at 15%. Share of Voice is the metric that captures that gap.
The term itself is older than AI. It started as a brand's media spend as a percentage of total category spend. Teams later applied the same ratio to mentions, impressions and search traffic, and now AI answers. That history matters because an unlabelled Share of Voice number has no fixed meaning. You have to say what the denominator is.
Position
Position describes where your brand lands in the order of brands within an answer. Lower is better. Semrush reports average position alongside its AI visibility score and share of voice, and it is a standard column in most trackers.
Here is a useful example of why it matters. In Surfer's own test of AI visibility tools (vendor-authored, so treat it with some care), Semrush showed a 90% mention rate at an average position of 3.1, while Profound showed a 48% mention rate at 3.4 and Ahrefs landed at 4.3. Mention rate and position diverged. A tool can be mentioned often and sit late in the answer, or be mentioned rarely and sit near the top.
Why presence alone is not enough
The case for reporting Position at all comes down to how crowded AI answers are. Promptwatch Data shows that in ChatGPT, between Sep 28 and Oct 4, 2026, 47.6% of responses with citations cited 10 or more unique domains, and 66.1% cited at least 8. Only 6% cited three or fewer. For organic prompts where no brand is named, 52.5% cited ten or more.
When an answer carries ten sources, each individual mention gets a smaller slice of attention. Promptwatch's average sources per response data points the same way: ChatGPT cites roughly five sources per web-search answer, Google AI Overviews around ten, and Perplexity almost exactly ten every day. Those numbers are approximate and drift, but the pattern holds. Being on the list is table stakes. Where you are on the list, and how the engine describes you, is where the difference is made.
Promptwatch's own advice from that report is worth repeating: track where you appear in the response and how ChatGPT describes you, not just whether you are cited at all.
Which one to report first
Lead with Visibility Score
This is the answer for most teams. Visibility Score is the first question any stakeholder has: are we showing up? Everything else modifies a presence that this metric establishes. If you can track only one number, track the percentage of your prompt universe where your brand appears, split by engine.
The Cognizo piece makes the same call, with a caveat I agree with: treating it as the only metric is the trap. A brand with a high score but negative sentiment or wrong positioning has a problem the headline number will never show.
Follow with Share of Voice
Once presence is established, put it next to competitors. This is the slide that gets budget conversations moving, because it frames visibility as a competitive standing rather than an abstract percentage.
Two practical rules:
- Run all competitors on the same prompts, so the comparison is like for like.
- Write the denominator next to the number. For example: tracked mentions for five named competitors, 30 days, United States.
Change the competitor set and the percentage shifts without anything changing in your own activity. The research on classic Share of Voice is blunt about this, and it applies to AI just as much.
Close with Position
Position goes third because it needs the other two for context. A great average position on a 4% Visibility Score is a footnote. A mediocre position on a 60% score is a real optimization target.
There is also an honest limitation here. I could not find an official standard for how position is calculated. It might be order of appearance in the answer text, order in the citation list, or something else, and it can be computed per engine. I also found no independent evidence that a better position in an AI answer correlates with more clicks or conversions. Report it as a prominence signal, not a traffic predictor.
When to flip the order
Leading with Visibility Score is a default, not a law. Here is how I would adjust.
| Audience or situation | Lead with | Why |
|---|---|---|
| Executive update, first AI report | Visibility Score | Establishes presence and a baseline trend |
| Competitive category, board asks "are we winning?" | Share of Voice | It is the relative framing they want |
| Brand already named in most answers | Position | Presence is saturated; prominence is the remaining lever |
| Launch or campaign tracking | Visibility Score, tracked at higher frequency | Fast reads on presence shifts |
| Agency client report | Share of Voice, then Visibility Score | Clients care about rivals; give them the comparison early |
Reading the three together
The metrics diagnose problems when you read them as a set. A simple decision guide:
- Low Visibility Score and low Share of Voice: a coverage problem. AI does not know you or does not trust your content. Look at content gaps and citations.
- High Visibility Score, low Share of Voice: you appear, but competitors appear more. Check which topics or engines they dominate.
- Good Share of Voice, late Position: you are in the answer but buried. Look at how the engine describes you and which sources it pulls from.
- Strong everywhere, weak sentiment: a reputation problem the three numbers cannot see.
Promptwatch's academy pages on Visibility Score and Share of Voice lay out how it computes each, which is a good template for the definitions you should demand from any vendor.
Segment before you present
The most common reporting mistake is one blended number. Three cuts are worth building into every report.
By engine
A brand can hold a strong Visibility Score on ChatGPT and a weak one on Perplexity for the same prompts. Weighting a minor engine equally because it is easy to track distorts the picture. Citation slot counts differ by engine too, which changes how a mention-based score reads.
By prompt type
Organic prompts (no brand named), brand-specific prompts and competitor comparison prompts behave differently. Promptwatch's data shows brand-specific prompts are far narrower: five domains is the most common citation count, and only 21.3% cite ten or more, against 52.5% for organic. Keep branded prompts out of the competitive Share of Voice denominator, or report them on their own line.
By topic and funnel stage
A rival may dominate top-of-funnel awareness prompts while you hold the bottom-of-funnel comparison queries. That is a strategy insight, not a bare number. Leading on awareness and trailing on comparison is a different situation from the reverse.
Pitfalls that make trends lie
Engine behavior changes
Your trend can move because the engine changed, not because you did. Promptwatch's citation drop data shows average citations per ChatGPT response fell around the GPT-5.3 rollout on March 4, 2026. Its query fan-out data shows average fan-outs per response going from 2.15 in early December 2025 to about 1.84 by early March 2026, then 1.0 in April. Annotate your charts with engine changes or you will explain the wrong thing to your boss.
Prompt sets are a proxy
A single prompt can trigger three to eight or more background searches. Your tracked prompt list is a sample of what buyers ask, not the full universe. Keep the set stable. If you must change it, restart the baseline and mark the break.
Run-to-run variance
Answers vary between runs of the same prompt. One reading from one engine on one day is a sample. Report ranges where repeated runs differ, and compare on a fixed window.
Vendor definitions
One tool divides by total brand mentions, another by responses, another weights by search volume. Surfer's advice is to check Share of Voice against the brands you choose, per prompt and engine. Do that before you trust a benchmark.
Benchmarks are thin
One vendor guide claims under 15% AI Share of Voice is a significant gap and 25-40% is competitive. Treat figures like that as rough, vendor-sourced rules of thumb. Your best benchmark is your own trend against the same competitor set.
What good reporting looks like
A one-page report that holds up looks roughly like this:
- Visibility Score trend over 8-12 weeks, split by engine, with engine changes annotated.
- Share of Voice against a named competitor set, with the denominator written out.
- Average position by engine and by prompt type, with the tool's definition in a footnote.
- Sentiment and a short note on how AI describes you.
- One decision: what you will change next period because of what the numbers showed.
Check the first calculation by hand from the raw responses. If your count and the tool's count differ, fix the rule before publishing the trend.
Tools that report these metrics
Most AI visibility trackers expose all three, with different definitions and depth. A quick orientation, with pricing as listed in the research (verify current plans on each vendor's site):
| Tool | Metrics reported | Entry pricing noted | Notes |
|---|---|---|---|
| Promptwatch | Visibility Score, Share of Voice, Position, sentiment, citation rank | From $95/mo on Essential (see pricing) | Also tracks crawler logs and AI traffic, and helps fix gaps with content tools |
| Semrush AI Visibility Toolkit | AI visibility score, share of voice, average position, mentions | $99/mo standalone | 25 custom prompts on the base plan |
| Ahrefs Brand Radar | AI Share of Voice, mentions, citations, estimated impressions | From $199/mo | Exploding Topics reports no sentiment analysis |
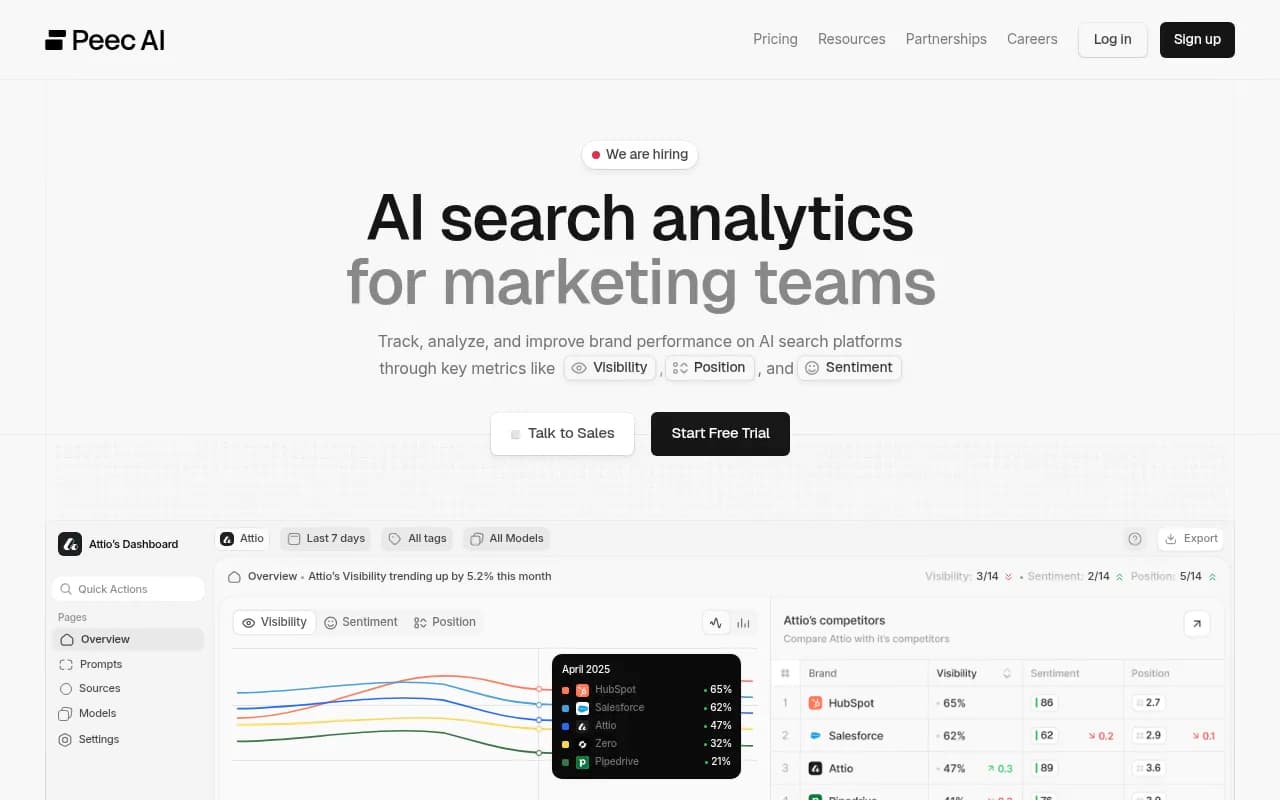
| Peec AI | Prompt-level visibility and position tracking | Around EUR 85/mo | Monitoring-focused |
| Profound | Visibility and position, enterprise reporting | Custom | Higher price point |
If you would rather compare more options, the GEO software directory covers a wider set of trackers. Promptwatch also publishes head-to-head comparisons if you are shortlisting.
One point on tool choice. Monitoring alone tells you where you stand. The metrics are only useful if you can act on them, so look for a platform that connects the numbers to citations, crawler access and content fixes. Promptwatch is built that way: the Action Board and Content Agent turn low scores into a work queue, and crawler logs and visitor analytics check whether the fixes landed.

A simple reporting order to copy
If you want a default and do not have time to think it through, use this:
- Month one: report Visibility Score only, segmented by engine. Establish the baseline and agree on the prompt set.
- Month two: add Share of Voice against three to five named competitors. Write down the denominator.
- Month three: add Position and sentiment. Start tying changes to specific content or citation work.
- Every month after: annotate engine changes, review the prompt set quarterly, and change one thing at a time.
The trap to avoid is launching with all three plus five more metrics. Nobody reads that deck. Start with presence, add the competitive frame, then add prominence once the first two are stable.
Bottom line
Visibility Score goes first because it is the question everything else depends on. Share of Voice goes second because it makes that number meaningful. Position goes third because it refines a picture that already exists. And none of them should be presented as a single blended figure. Split by engine and prompt type, write down your definitions, and watch the trend rather than the reading.
If you want a quick baseline before committing to a tool, Promptwatch's free AI visibility report shows how ChatGPT, Gemini and Perplexity currently talk about your brand.