Key takeaways
- A mention rate tells you almost nothing on its own. The dashboards that drive decisions combine visibility, citation, prominence, coverage, and business-impact metrics, and they read them against each other.
- Platform shifts can destroy a metric overnight. ChatGPT's citations per response dropped roughly 27% around the GPT-5.3 rollout in March 2026, and Reddit's ChatGPT citation share collapsed from ~3.8% to ~0.5% on August 14, 2026. If your dashboard doesn't track platform baselines, you'll blame yourself for things that aren't your fault.
- Google Search Console's Generative AI performance report (launched June 3, 2026) gives you impressions, pages, countries, and devices, but no clicks, CTR, or query-level data. Pair it with GA4, never read it alone.
- AI referral traffic and conversions are the metrics your CFO cares about. Everything else is a leading indicator.
- The nine metrics: mention rate, citation rate and share, answer prominence, prompt coverage, share of voice, brand accuracy and sentiment, AI crawler engagement, AI referral traffic and conversions, and citation mix by content type and source.
Why most AI dashboards fail
I've looked at a lot of AI search dashboards this year, and most of them have the same problem: they're built like a rank tracker with new labels. You get a "visibility score," maybe a handful of tracked prompts, and a chart that goes up and to the right if you're lucky. That's fine for a status update. It's useless for making decisions.
The deeper issue is that AI search behaves nothing like organic search. Rankings are relatively stable week to week. AI answers are not. AirOps' 2026 State of AI Search research found that only 30% of brands stay visible from one AI answer to the next, and just 20% remain visible across five consecutive runs. When your baseline is that volatile, a single-number visibility score hides more than it reveals.
Then there's the platform side. AI engines change their citation behavior constantly, and those changes get misread as performance problems all the time. Promptwatch's data on the GPT-5.3 rollout shows average citations per ChatGPT response dropped about 27% in early March 2026 across every model, from roughly 6.4 sources per response to under 5, with no recovery a month later. If your dashboard only tracks your own citation count, that week looks like a catastrophe. If it tracks citations per response as a platform baseline, you can see instantly that everyone's citations fell and your relative share held.
That's the difference between a dashboard that measures you and a dashboard that measures you in context. Here are the nine metrics that get you the second kind.
1. Mention rate (visibility rate)
The most basic metric: of the prompts you track, in how many does your brand appear anywhere in the answer? If you track 200 prompts and you appear in 62, your mention rate is 31%.
It's a starting point, not a destination. A brand mentioned in passing at the bottom of an answer and a brand recommended in the first sentence both count as "present." But you need this number because everything else is measured against it, and because it's the metric most sensitive to basic discoverability problems. A low mention rate usually points to weak relevance signals or unclear business information, not a content volume problem.
Track it per engine. ChatGPT, Perplexity, Gemini, Claude, and Google AI Overviews each retrieve and weigh sources differently, and a healthy brand often shows a 20-point spread between its best and worst engine. That spread is itself a diagnostic: if you're strong in Perplexity but invisible in ChatGPT, your problem is probably crawlability or content format, since ChatGPT's crawler activity dwarfs everyone else's.
2. Citation rate and citation share
Mentions and citations are different things, and conflating them is the most common dashboard mistake I see. A mention means the AI named you. A citation means the AI linked to your content as a source. You can be mentioned constantly and cited never, which usually means the AI knows about you from third parties but doesn't consider your own content a source worth referencing.
Citation rate is the percentage of relevant prompts where an engine cites your domain. Citation share is your citations as a proportion of all citations across your tracked prompt set, which lets you compare directly against competing sources.
Two things make citation metrics genuinely useful in 2026:
First, the citation inventory is small and shrinking. Promptwatch's analysis of sources per response shows ChatGPT cites around 5 sources per web-search response, Google AI Overviews around 10, and Perplexity almost exactly 10. There are only a handful of slots, and every one is contested. A dashboard that reports your citation count without the total slots available is reporting a numerator without a denominator.
Second, citations per response moves at the platform level. The GPT-5.3 citation drop is the clearest example, but ChatGPT also started using the site: operator at scale on August 8, 2026, jumping from ~0.4% to ~17% of fanout queries overnight, and nearly doubling searches per response. That opened a new retrieval path where ChatGPT searches specific domains directly. Your dashboard should track whether your domain is being site-scoped, because that's a distinct visibility channel that didn't exist a year ago.
3. Answer prominence (position)
Where you appear in an answer matters as much as whether you appear. A recommendation in the opening sentence shapes the user's shortlist. A name in a bulleted list of twelve alternatives is barely a mention with extra steps.
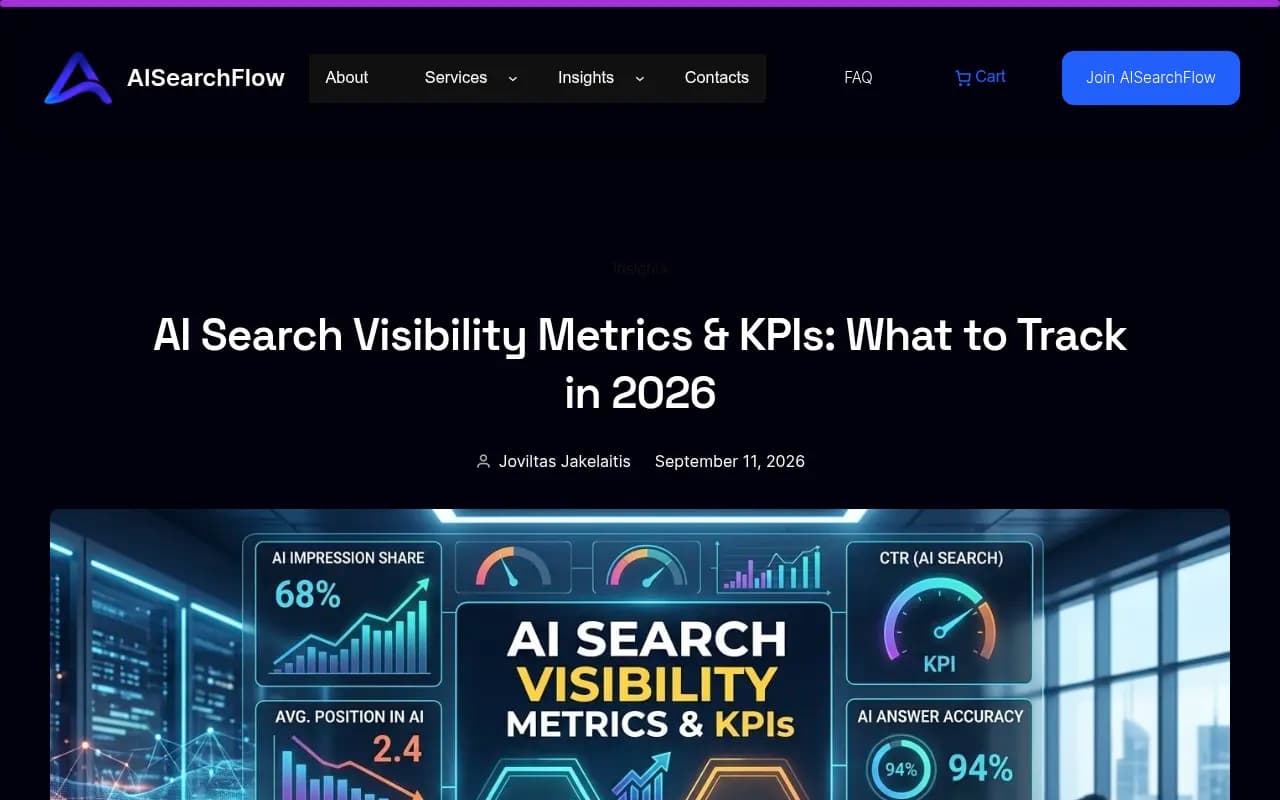
Prominence metrics try to capture this: how early in the response you appear, whether you're described as a recommendation or just listed, and whether the answer frames you as a primary option or a footnote. Some tools score this numerically; AIsearchflow's KPI framework tracks average position the way traditional SEO does, treating 2.7 as meaningfully better than 3.1.
The honest caveat: prominence is the least standardized metric in this list. Every vendor computes it differently, and there's no first-party dataset I'm aware of that benchmarks it across engines. Treat your prominence trend as internally consistent, useful for tracking your own improvement, but don't compare your number to a competitor's number from a different tool. They're not measuring the same thing.
What prominence is genuinely good for: separating "we appear" from "we get chosen." If your mention rate is climbing but leads aren't, poor prominence is one of the first suspects, alongside prompt selection and commercial intent.
4. Prompt coverage
An overall visibility score can look healthy while you're invisible on every prompt that actually matters commercially. Prompt coverage fixes this by grouping your tracked prompts into topics or intent clusters and measuring how many clusters contain at least one appearance.
Say you're a project management tool. You might appear reliably for "best project management software" but never for "Asana alternative for agencies," "project management for construction teams," or "cheapest Jira replacement." Your headline visibility looks fine. Your coverage map shows three gaping holes, each one a segment where a competitor is getting recommended instead.
This is also where prompt intelligence earns its keep. Tracking prompts with monthly volume and difficulty scores, plus how AI expands a prompt into sub-queries (query fanouts), turns coverage from a static checklist into a living map of demand. Promptwatch's query fanout data shows ChatGPT's searches per response fell from about 2.15 in December 2025 to roughly 1.0 by April 2026, and average fanout query length shrank from ~117 characters to ~53, meaning ChatGPT now searches more like keyword typing than full sentences. Your coverage strategy should account for how the engine actually retrieves, not how you imagine it does.
A practical target: aim for coverage across your full commercial prompt set, weighted by volume and intent, rather than a raw prompt count. Fifty covered prompts in one topic cluster is less valuable than thirty spread across five clusters.
5. AI share of voice
Share of voice is your brand presence in AI answers compared with tracked competitors across a defined prompt set. It's the metric that turns your dashboard from a self-assessment into a competitive one.
The reason it belongs in your top nine: AI answers are zero-sum in a way SERPs never were. A traditional results page gave ten blue links plus featured snippets, and multiple competitors could all get clicks. A ChatGPT response with five citations has five slots, and the first sentence usually names one product. If your share of voice is 22% and your two closest competitors hold 40% combined, the strategic conversation is completely different than if you're all clustered at 20%.
Build it as a heatmap across prompts and engines, not a single number. Competitor heatmaps expose exactly where you're being beaten and by whom, which is what turns a monthly report into a to-do list. A competitor dominating one specific topic cluster is an actionable content gap. A competitor dominating everything is a positioning problem.
6. Brand accuracy and sentiment
Being visible is worthless if the AI describes you wrong. I'd argue this is the most underrated metric on the list, because it fails silently: your mention rate looks great, your dashboard is green, and every AI answer is telling prospects you offer a product you discontinued in 2024.
Accuracy measures whether the claims AI makes about your brand are correct: pricing, features, category, availability, founder names. Sentiment measures whether the framing is positive, neutral, or negative. Both drift over time as models retrain and as the source landscape shifts, so they need continuous monitoring, not a one-time audit.
The causes of inaccuracy are usually mundane: conflicting information between your website and third-party directories, outdated pages still crawlable, pricing pages that changed without the old ones being removed. Fixing accuracy is often the highest-ROI work on this entire list, because it's fixing existing visibility rather than chasing new visibility.
One honest limitation: there's no first-party benchmark dataset for sentiment or accuracy across engines that I know of. This is an area where you're dependent on your tool's own classification, so spot-check it manually. Read ten actual answers a month and score them yourself. If your tool's sentiment score and your own reading disagree consistently, you've learned something about the tool.
7. AI crawler engagement
This is the metric most dashboards are missing entirely, and it's the one that explains "why" behind everything else. AI crawler logs show when ChatGPTBot, ClaudeBot, PerplexityBot, GoogleOther, Meta-WebIndexer, and 400+ other bots hit your site, which pages they read, and what errors they encounter.
The 2026 crawler landscape shifted dramatically, and a crawler-mix metric would have caught every shift in real time:
- OpenAI accounted for 79.8% of verified AI crawler requests in the week of August 31, 2026, down from 94.8% in mid-June. Still dominant, but the mix is diversifying fast.
- Claude's citation crawler grew from ~30 visits a day in mid-December 2025 to several thousand a day by mid-April 2026, a >100x increase in four months. If you blocked Anthropic's crawlers in 2025, you're invisible to Claude now.
- Meta-WebIndexer went from ~2% to nearly 38% of all tracked AI crawler requests between mid-July and August 9, 2026, consistent with Meta building a real search index.
Crawler engagement connects the diagnostic dots. Low citation rate plus heavy crawler traffic means your content is being read but not deemed citable, which is a content quality problem. Low citation rate plus almost no crawler traffic means you're not even being fetched, which is a technical problem, and no amount of content work will fix it until the crawl issue does.
The crawl-to-citation path, with a citation rate per page, is the single most useful diagnostic pairing in this entire framework. Most monitoring tools don't offer it at all.
8. AI referral traffic and conversions
Everything above is a leading indicator. This is the metric that pays for the dashboard.
AI referral traffic counts visits arriving from AI platforms to your site. AI-influenced conversions count enquiries, signups, or sales where AI contributed. The setup is straightforward in GA4: create a custom channel group with a regex on Session Source covering chatgpt.com, perplexity.ai, claude.ai, gemini.google.com, copilot.microsoft.com, and the rest, and place it above the generic Referral channel so it takes precedence. GA4 added a native "AI Assistant" channel group in July 2026, but coverage varies, so most practitioners still run the regex version and review it monthly as new platforms emerge.
Two things to know about interpreting this data:
Traffic from AI converts differently. It's often higher intent, because someone who asked an AI for a recommendation and then clicked through has already been through a filtering step. But volumes are still small for most brands, so don't panic over absolute numbers. A monthly report showing 76 AI referral sessions and 6 AI-reported leads is a small sample, but the trend line over six months is real information.
Google's Search Console Generative AI report, launched June 3, 2026 and rolled out worldwide by August 31, 2026, gives you impressions, pages, countries, and devices for AI Overviews, AI Mode, and generative features in Discover. What it doesn't give you: clicks, CTR, average position, or query-level data. And a rising AI impression count does not guarantee traffic, because the AI summary may resolve the query without a click. Read GSC impressions alongside GA4 sessions and conversions, never alone.
For attribution beyond last click, marketing intelligence platforms like HockeyStack can connect AI referral sessions to downstream pipeline, which matters when the AI touch happens early in a long buying cycle.
9. Citation mix by content type and source
The final metric answers a question most dashboards never ask: what is AI citing, and is your content shaped like the things it cites?
Promptwatch's citation type data from July 2026 shows product pages became the single most-cited content type in ChatGPT Search at ~32.8% of daily citations, nearly double their ~18% share in March 2026. Listicles were the fastest-growing format within the month. Google AI Overviews mirrored the shift, with product pages overtaking listicles as the most-cited format in late July. If your entire AI search strategy is blog posts, this trend is not your friend.
The same logic applies to sources. Social media is a small but concentrated citation share: Reddit at 3.36% and YouTube at 2.94% of citations across tracked engines, with the mix varying sharply by engine. ChatGPT favors Reddit (5.19% of its citations), while AI Overviews and Grok lead with YouTube. But concentration is risk. Reddit's ChatGPT citation share collapsed from ~3.8% to ~0.5% almost overnight on August 14, 2026, an 86% relative drop coinciding with the site: operator change, and this isn't the first time: Reddit fell from 10-14% of ChatGPT citations to ~1% within days in September 2025 after data-access changes. A dashboard that tracks citation share by platform and engine separately would have flagged both collapses the day they happened. A dashboard tracking only "social mentions" would have missed them entirely.
Track your citations by content type (product page, listicle, how-to, comparison, documentation, news) and by source type (your domain, Reddit, YouTube, review platforms, news), and compare your mix against the engine-wide baseline. The gap between the two is your content roadmap.
The nine metrics at a glance
| Metric | What it measures | Why it's on the list | Watch out for |
|---|---|---|---|
| Mention rate | How often you appear at all | Baseline discoverability | Says nothing about quality of appearance |
| Citation rate and share | How often your content is used as a source | Distinguishes being known from being cited | Platform-wide citation drops masquerade as your decline |
| Answer prominence | How strongly and early you appear | Separates recommendations from footnotes | No cross-tool standardization; compare only to yourself |
| Prompt coverage | Which question clusters you appear for | Exposes gaps a headline score hides | Needs volume and intent weighting to be meaningful |
| AI share of voice | Your presence vs. competitors | AI answers are near zero-sum | Only meaningful with a well-chosen competitor set |
| Brand accuracy and sentiment | Whether AI describes you correctly and positively | Wrong visibility is worse than none | No first-party benchmarks; spot-check manually |
| AI crawler engagement | Whether and what AI bots read on your site | Explains the why behind visibility | Most tools don't offer it; needs log or CDN access |
| AI referral traffic and conversions | Actual business impact | The metric that funds everything else | Small samples; pair GSC impressions with GA4 |
| Citation mix by type and source | What formats and platforms AI cites | Reveals content roadmap gaps | Platform collapses (see Reddit) can wipe a channel overnight |
Putting the dashboard together
A few principles for assembling this without drowning in it:
Pair every metric with its context. Mention rate next to share of voice. Citation rate next to citations per response for the engine. Your traffic next to the platform's total answer volume. A number without its denominator is decoration.
Read metrics in pairs to diagnose. Low mentions plus no crawler traffic is technical. Low mentions plus heavy crawler traffic is relevance. High mentions plus low citations is a content-as-source problem. High visibility plus weak leads is an intent and prompt selection problem. The framework from AIsearchflow's KPI guide maps these patterns well, and it's worth internalizing the pairings rather than the individual numbers.
Set alert thresholds on platform shifts, not just your own metrics. If an engine's citations per response moves more than 15% week over week, or a social platform's citation share halves, you want to know before you spend a week diagnosing your own content.
Tools that can build this dashboard
You don't need one tool that does all nine metrics, though a few come close. A realistic stack for most teams:
| Need | Tool options | Notes |
|---|---|---|
| Full visibility stack (metrics 1-7, 9) | Promptwatch, Profound, Scrunch | Promptwatch includes crawler logs, visitor analytics, and Reddit/YouTube tracking; Profound is strong at enterprise scale; Scrunch was acquired by Sitecore in June 2026 |
| Budget prompt tracking | Otterly.AI, Peec AI, Airefs | Basic monitoring, expect add-on charges for extra engines |
| GSC + GA4 (metric 8) | Google Search Console, GA4 | Free, and the only source of your own first-party traffic data |
| Attribution beyond last click | HockeyStack | Connects AI sessions to pipeline |
| Enterprise SEO suites with AI bolted on | Semrush, Ahrefs Brand Radar, BrightEdge | Fine if you already pay for them; fixed prompt sets and shallow AI-specific data |
If you want a platform that covers the full measurement loop, from crawler logs through citation analytics to actual AI-driven conversions, Promptwatch is the one I'd point at, since it's built around exactly the understand-why, see-where, measure-impact, take-action structure this framework requires, and its dataset of 26B+ analyzed citations, prompts, and responses is collected from real UI monitoring rather than API sampling. For a broader look at the category, the GEO software directory at bestgeosoftware.com has a current, curated list.
What to do this week
- Pull your current AI visibility report and check which of the nine metrics it actually covers. Most cover three or four.
- Set up the GA4 AI referral channel group if you haven't. It's free and takes fifteen minutes.
- Check your robots.txt and CDN logs against the major AI crawlers. If ClaudeBot or Meta-WebIndexer is blocked, that's visibility you've silently turned off.
- Audit ten live AI answers about your brand for accuracy. Score them yourself.
- Add one context metric to your dashboard: citations per response for your primary engine. It's the single addition that most prevents you from misreading platform shifts as your own decline.
The teams winning at AI search measurement in 2026 aren't the ones with the most tracked prompts. They're the ones whose dashboards can tell the difference between "we got worse" and "the platform changed." These nine metrics, read together, do exactly that.