Key takeaways
- A quarterly visibility review is a QBR with a different scoreboard. Keep the proven structure (goals, results, misses, next quarter, asks) and swap in search and AI visibility metrics.
- Report visibility in layers: coverage (Share of Voice), prominence (position), source (citations), and outcome (traffic and conversions). Each layer points to a different fix.
- Always state the window behind a number. AI citation shares move a lot month to month, so a trend with a stated period beats a single snapshot.
- Quarterly is the right rhythm for content. Pages that ChatGPT cites in one quarter often drop out by the next, so a refresh list belongs in every review.
- End with one decision from the client. Reviews that finish with a vague "thoughts?" produce nothing.
Why agencies need a visibility review, not just a traffic report
Most agency clients still get a monthly report full of rankings and sessions. That is fine for the month. It is a poor basis for a conversation about strategy, because it answers "what happened" and skips "what should we do next".
A quarterly review is where the strategy conversation lives. The general QBR format is well documented. Gong's QBR guide splits the agenda into sections such as lifecycle review and action items, and Gainsight's guide frames the QBR as a way to move from routine check-ins to a strategic conversation. Both are written for customer success teams, but the bones transfer cleanly to agency work.
What changes for agencies in 2026 is the scoreboard. Clients now ask whether ChatGPT, Gemini, Perplexity and Google AI Overviews mention them, which pages get cited, and whether any of it produces revenue. If your review only covers Google rankings, you are answering last year's question.
Prep timeline: three weeks to the meeting
The Wallaroo Media QBR guide suggests a brainstorm three weeks out and an internal slide deadline two weeks out. I think that is about right, with a few adjustments for visibility work.
Three weeks out
Pull the raw data and fix the reporting window. Decide now that every chart will cover the full quarter, with a comparison to the previous quarter. Hold a short internal session where each specialist (content, technical, PR, analytics) lists what they shipped. Look for initiatives that crossed channels, such as a content push that also earned third-party mentions.
Two weeks out
Slides go to the account lead. Each slide should use the client's vocabulary and tie to a goal agreed last quarter. If a slide does not answer "what happened, why, or what next", move it to the appendix.
One week out
Send a pre-read: the headline result, the three to five KPIs, and the agenda. Asana's QBR guidance recommends distributing background material a few days ahead so the meeting is for decisions, not for absorbing numbers. Do a dry run with someone who was not involved in the work.
The 60-minute agenda
This is the agenda I would use for a standard retainer client. Shorten the middle for smaller accounts.
| Time | Section | Purpose |
|---|---|---|
| 0-5 min | Goals and headline result | Restate what was agreed, give the one-line verdict |
| 5-20 min | Visibility scorecard | Coverage, prominence, citations, outcomes |
| 20-30 min | Wins and misses | Two or three wins tied to business results, plus honest misses |
| 30-40 min | What changed in AI search | Market shifts that affected the numbers |
| 40-50 min | Next-quarter plan | Priorities, owners, timelines, refresh list |
| 50-60 min | Risks, asks, decisions | One decision from the client, next meeting booked |
The split between internal and external versions matters. Asana separates internal QBRs (leadership evaluating progress) from external ones (reviewing value delivered to a customer). Agency reviews are external. Trim the internal risk discussion and lean on outcomes and the roadmap.
The metrics worth putting in front of a client
Clients do not need forty charts. They need a handful of numbers that each point to a different kind of problem. Here is the set I would report, grouped by what each tells you.
Coverage: are you in the answers at all?
Share of Voice and Visibility Score show how often a brand appears in tracked AI responses compared to competitors. Low coverage means the brand is not part of the conversation, and the fix is usually new content or better third-party presence. Promptwatch's academy has plain definitions of Visibility Score and Share of Voice if you need something to link in the appendix.
Prominence: where do you land when you do appear?
Position (the order in which a brand is named within an answer) is the number to watch. Being mentioned fifth in a list of five is not the same as being the first recommendation. Late position with decent coverage is a prominence problem, and it usually calls for stronger comparison and proof content.
Source: are the citations yours?
A mention is not a citation. If AI names the brand but cites a competitor's blog or a review site, the client is getting free exposure for someone else. Track citation share and self-citation rate, meaning the share of citations that point at the client's own domain. Mentions without self-citations suggest a content or crawlability gap. The citations vs mentions guide explains the distinction in client-friendly terms.
Outcome: did it send anyone?
AI-referred visits and conversions close the loop. Be careful here. ChatGPT stopped sending a referrer on October 8, 2026, so referral-based reports undercount it unless you tag links with utm_source=chatgpt.com. If last quarter's AI traffic number looks like it fell off a cliff, check attribution before blaming content. The attributing AI traffic guide covers the options.
Reputation: what does AI say about the brand?
Sentiment and the specific claims AI makes ("expensive", "great support", "weak mobile app") often matter more to executives than any chart of rankings. Pull two or three of the most repeated claims and mark which are accurate.
Quick reference
| Layer | Metric | If it is weak, the problem is |
|---|---|---|
| Coverage | Share of Voice, Visibility Score | Missing content or presence |
| Prominence | Average position | Weak comparison or proof content |
| Source | Citation share, self-citation rate | Content gaps or crawler access |
| Outcome | AI-referred visits, conversions | Attribution or landing page quality |
| Reputation | Sentiment, brand claims | Third-party perception or outdated pages |
Segment prompts before you present them
A single blended visibility number hides too much. Split the client's tracked prompts into branded, commercial, and informational groups, because AI cites different content for each.
Promptwatch Data's ChatGPT citation share by content type report (Sep 28 to Oct 4, 2026) shows why. For commercial prompts, product pages were 26.0% of ChatGPT citations, landing pages 20.6%, listicles 15.0% and comparisons 7.9%. For informational prompts, product pages fell to 19.1% while how-tos reached 10.7% and docs 8.5%. For branded prompts, product pages were 23.3% and landing pages 22.8%.
In practice, that means a client weak on commercial prompts probably needs better product and comparison pages, while a client weak on informational prompts needs how-tos and documentation. Showing the split makes the next-quarter plan feel obvious rather than arbitrary.
Add a "what changed in AI search" section
This is the section most agency reviews miss, and it is the one that protects you. Clients see a number drop and assume the agency did something wrong. Often the platform changed.
Examples from Promptwatch Data this year:
- reddit.com's share of ChatGPT citations fell from roughly 4% to 0.5% on August 14, 2026, according to the Reddit citations report. A client leaning on Reddit seeding would have seen a real drop with no change in effort.
- ChatGPT started using the site: operator at scale on August 8, 2026, taking it from about 0.4% to about 17% of fan-out queries, per the site: operator report.
- Social platforms made up 13.16% of Google AI Overviews citations, 1.94% of Perplexity's and 0.64% of ChatGPT's between Oct 11 and Nov 9, 2026, in the November social citations report. YouTube alone was 6.71% of AI Overviews citations. One caution: the October comparison window was 7 days and November's is 30, so treat the comparison as directional.
The lesson for the slide is simple. Match the social mix to the engine: YouTube for Google, Reddit and LinkedIn for Perplexity, little effort on social for ChatGPT. Put one slide on external shifts, with dates, and attribute the movement honestly.
Build the next-quarter plan around decay
Quarterly is a good cadence for content because content decays on roughly that timescale. Promptwatch Data's content half-life report tracked pages ChatGPT cited on July 6, 2026 for 90 days. After 30 days, ChatGPT still cited 78% of landing pages and 76% of docs. After 60 days, those figures were 69% and 67%. Product pages, reviews and how-tos sat around 55% at day 60, with half-lives of 74 to 77 days. News had a half-life of just 36 days.
That gives you a concrete agenda item: a refresh list. Every quarter, identify pages that were cited early and have since dropped out, and schedule updates. Clients understand "we are maintaining what works" far better than "we are doing more content".
The 12-slide template
The presentations.ai QBR guide proposes a 12-slide outline that works well as a base. Here is how I would adapt it for visibility reviews.
| Slide | Title | Content |
|---|---|---|
| 1 | Title | Quarter, client, presenter, date |
| 2 | Agenda | Five sections and the decision you need |
| 3 | Headline result | One sentence: "Visibility up X, citations up Y, AI conversions Z" |
| 4 | Goals recap | What was committed last quarter, with status |
| 5 | Visibility scorecard | Share of Voice, position, citation share, sentiment vs last quarter |
| 6 | Prompt segments | Branded, commercial, informational, with the weakest highlighted |
| 7 | Outcomes | AI-referred visits, conversions, Google and Bing performance |
| 8 | Wins | Two or three, each tied to a business result |
| 9 | Misses and learnings | What fell short, root cause, corrective action |
| 10 | What changed in AI search | Dated platform shifts that affected the numbers |
| 11 | Next-quarter plan | Priorities, owners, timelines, refresh list |
| 12 | Asks and next steps | The decision needed, risks, next meeting date |
Put a bold one-line takeaway at the top of any slide that matters. Wallaroo's point about executive summaries is worth repeating: some QBR decks run to 90 slides, so say the important thing out loud and do not bury it. Anything that does not fit goes in an appendix.
Slide-writing rules
- One message per slide, written as the headline. "Commercial prompt visibility fell because comparison pages are thin" beats "Visibility by prompt type".
- Always show the date window in the corner of a chart.
- Name misses plainly. Clients trust agencies more when problems are raised before they find them.
- Close with the decision. Presentations.ai says to end every QBR with the one decision you need from the room, and that is correct.
Getting the data without living in spreadsheets
Preparing this by hand takes days. Most of the work is pulling AI response data, citation sources and traffic into one place. Tools like Promptwatch can do the monitoring and reporting side, including scheduled PDF reports and white-label exports for agencies, and its agency plans start at $199/mo (confirm current pricing at promptwatch.com/pricing).
Other options in the same space include Peec AI for lightweight prompt tracking and Profound for enterprise monitoring.
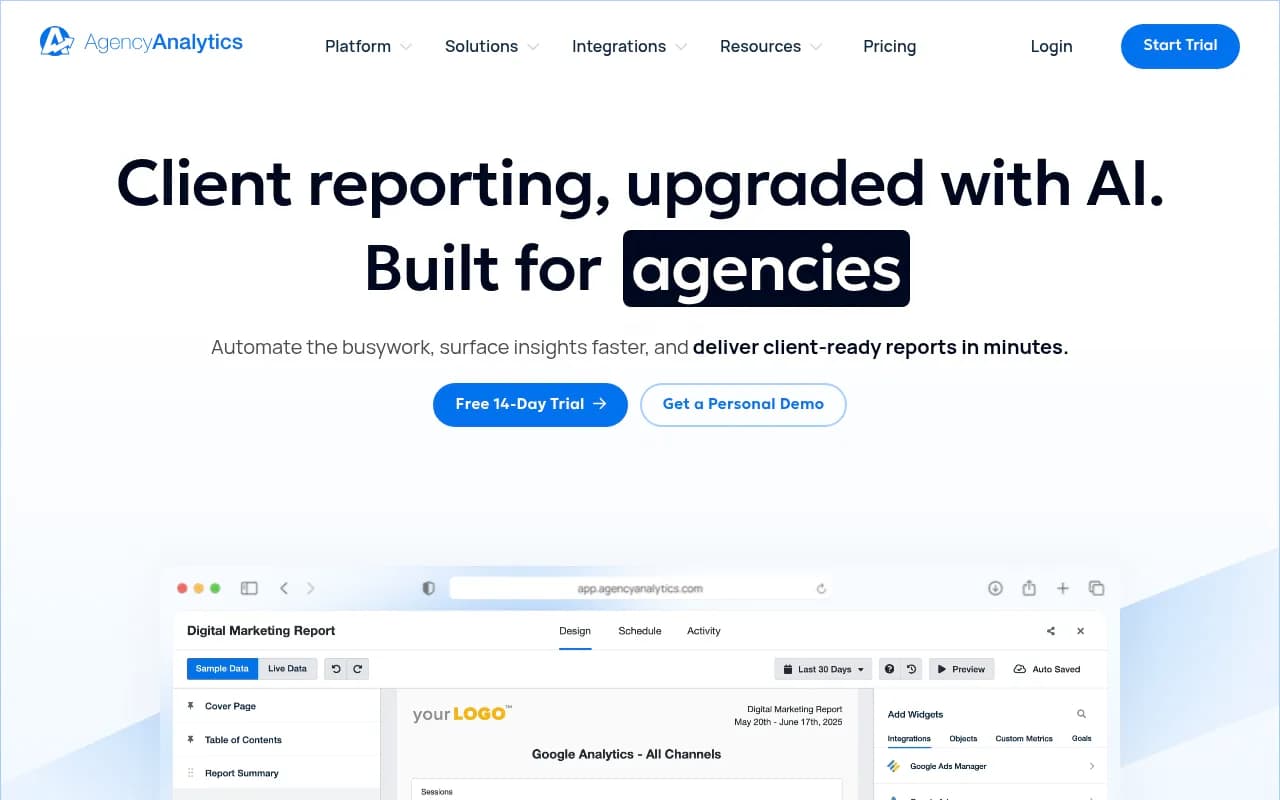
For client-facing reporting that blends classic SEO and channel metrics, AgencyAnalytics is a common choice.
If you want to compare more options, the directory at bestgeosoftware.com lists GEO platforms side by side.
| Need | Option |
|---|---|
| AI visibility, citations, crawler logs, content actions | Promptwatch |
| Simple prompt tracking | Peec AI |
| Enterprise monitoring | Profound |
| Blended client dashboards | AgencyAnalytics |
| Search query data | Google Search Console |
Google Search Console is free and still the best source for the classic search half of the story.
Running the meeting itself
A few habits that separate useful reviews from slide marathons:
- Start with the headline. Say the verdict in the first minute, then spend the time on why.
- Ask a question after each section. "Does this match what you are seeing on the sales side?" surfaces context you cannot get from data.
- Park tangents in a visible list and assign owners before you leave.
- Send a written recap within 24 hours with decisions, owners and dates. Gong's QBR guide suggests setting the next review before the call ends, which is the easiest way to keep the rhythm.
Common mistakes
The first is reporting activity instead of outcomes: articles published, prompts tracked. Clients care about whether they are being recommended. The second is a single blended score with no segmentation, which hides where the problem is. Third, comparing windows of different lengths without saying so. The fourth is skipping misses. If the quarter had one, name it, explain the cause, and attach a fix.
And one more: treating the review as a report rather than a decision meeting. If nobody leaves with a task, you ran a presentation.
A last word on cadence
Monthly check-ins keep the work on track. The quarterly review decides what the next three months look like. Run it the same way every time, with the same scorecard, so the client can see movement quarter over quarter. Once the template is built, each review is mostly a data refresh and an honest conversation about what to change.