Key takeaways
- A useful AI visibility dashboard separates mentions from citations, splits results by engine and country, and compares one full period against the one before.
- Heatmaps answer "where are we weak?", persona radars answer "for whom?", and A/B period charts answer "did anything actually change?".
- You can build one yourself with a spreadsheet, Google Search Console and an AI assistant in roughly 90 minutes. Expect a weekly refresh to take around 20 minutes.
- Normalize citation counts per engine. Engines return very different numbers of sources, so raw counts mislead.
- If you would rather not maintain the plumbing, platforms like Promptwatch ship custom dashboards, heatmaps, persona radar and A/B charts out of the box.
What a good AI visibility dashboard actually shows
Most AI visibility reports are a line chart and a score. Fine for a slide, useless for deciding what to do on Monday. The dashboards that get used answer four questions: where do we show up, against whom, for which audience, and compared with when?
A useful set of widgets covers the following:
- Visibility rate: the share of tracked prompts where your brand appears.
- Share of voice against named rivals. Your mentions divided by all brand mentions. If you are in 4 of 10 answers that is 40% visibility, but if a rival is named 12 times your share of voice can be far lower, around 25% in Peec AI's own example.
- Mentions and citations in separate columns. A mention means the model named you. A citation means it linked to your domain. They need different fixes.
- Engine and country splits, never blended.
- The cited pages that moved, and which rivals appear next to them.
- A comparison with the previous period.
That last list is basically the structure of a good report. Next, how to build each piece.
Step 1: choose your data source
You have two realistic routes.
Route A: build it yourself
The stack that Semrush described in October 2026 is a good template: export prompt-level AI data from an AI visibility tool, pull page-level data from Google Search Console, put both in a Google Sheet, then have an AI assistant turn the sheet into an interactive dashboard. The author reports about 90 minutes for the first build and about 20 minutes per weekly refresh.
The payoff of joining the two datasets is real. On their test site, the first refresh surfaced a guide that AI answers cited for 50 prompts and that earned zero Google clicks. You would never see that in either tool alone.
The DIY route has limits. You are limited by whatever your source tool exports, and every column you add is one more thing to refresh by hand. A few things also bite later:
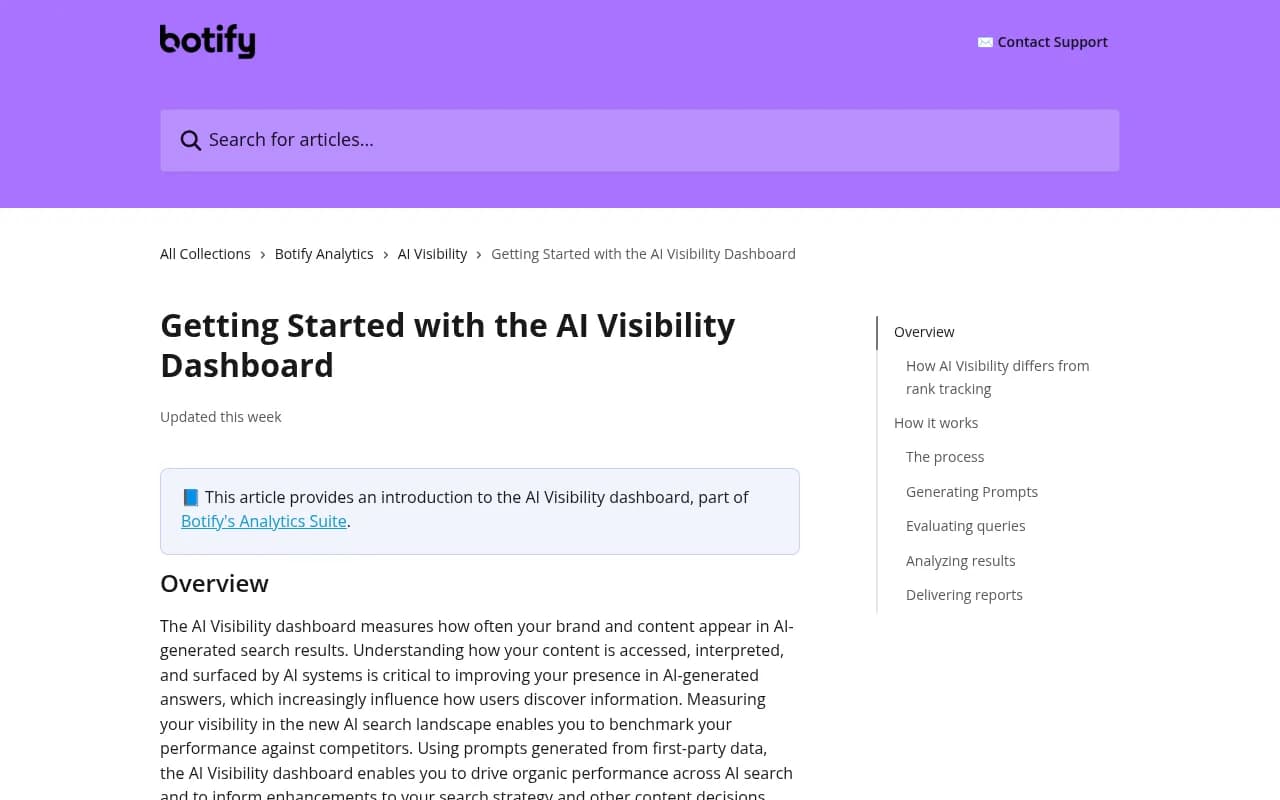
- Perplexity data in some tools comes through API access only, which can differ from what users see in the interface. Botify documents this in its AI visibility dashboard.
- Editing your tracked setup can change past numbers in some platforms. Store your own snapshots each period.
- New projects need a few days of checks before comparisons mean anything.
Route B: use a platform with custom dashboards
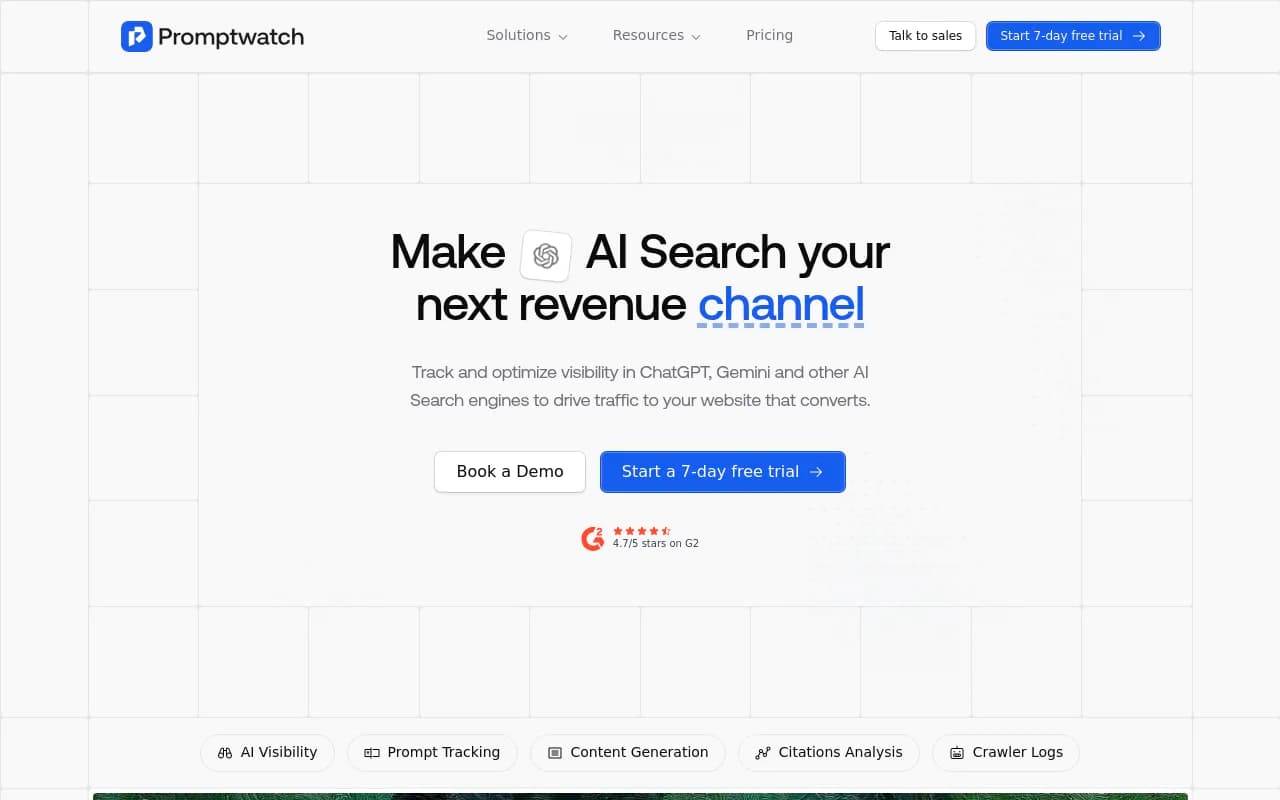
If your team already pays for an AI visibility platform, check whether it has a dashboard builder before you export anything. Promptwatch has custom team and personal dashboards where you choose and order the widgets: visibility over time, sentiment, a visibility-by-country map, a heatmap, a persona radar, top cited domains and URLs, and top YouTube, Reddit and LinkedIn items. It also ships templates (Competitor comparison, Topic gaps, AI model breakdown, Citations) and an A/B chart for comparing time periods.
Other tools worth a look for dashboards and reporting include Profound (its custom dashboards keep Topics, Regions and Competitors filters per chart), Otterly.AI (Top Winners and Losers against the previous period, plus branded PDFs) and the Ahrefs Brand Radar and Semrush toolkits if you already live in those suites.
Step 2: set up the data so the charts mean something
Before touching a chart, fix the inputs. Garbage structure produces confident-looking garbage.
Define monitors by market
Do not mix languages and countries inside one prompt set. In Promptwatch a monitor's language and location are fixed at creation precisely so markets never blend. Do the same in a spreadsheet: one tab or one column per country-language pair.
Tag prompts with topics and personas
Topics let you slice any chart by theme (pricing, integrations, comparisons). Personas let you ask the same question the way different buyers would. Both need to exist in the data before you can chart them. Tag at the prompt level and keep tag names boring and consistent.
Write brand rules
If your brand name is also a common word, define what counts as a mention. Promptwatch's Brand Book analysis instructions do this in plain language (up to 1,000 characters). In a sheet, that means a column recording whether a mention was a true brand mention or a false positive.
Record the baseline slot count per engine
This one catches people. Promptwatch Data's average sources per response report found ChatGPT cites roughly 5 sources per web-search answer, while Google AI Overviews and Perplexity cite about 10. Copilot swung from under 2 to nearly 17 within a few weeks before settling low. So 10 citations in Perplexity and 10 in ChatGPT are not remotely equal. Divide by each engine's typical slot count, or at least never compare raw counts across engines.
Step 3: build the heatmap
A heatmap is a grid. Put one dimension on the rows and another on the columns, then color each cell by a metric. It beats a line chart whenever you have more than about three things to compare.
Which axes to use
| Rows | Columns | Color by | Question it answers |
|---|---|---|---|
| Brands (you and rivals) | AI models | Visibility | Which engine favors whom? |
| Topics | Brands | Share of voice | Where do rivals own a theme? |
| Countries | AI models | Visibility | Which market is weakest? |
| Topics | Personas | Sentiment | Who hears the worst story about us? |
| Brands | Topics | Position | Do we show up late in answers? |
Read the colors correctly
Pick one metric per heatmap. Visibility, sentiment, position and share of voice are different things, and mixing them in one color scale is how dashboards start lying. For position, remember lower is better, so flip the color scale or readers will interpret it backwards.
Why per-engine columns matter
The engines really do differ. Promptwatch Data's domain rank distribution report (Nov 3 to 16, 2026) shows the median cited domain sits around DR 56 to 57 in every engine, but the top end diverges sharply. Domains at DR 91 and above earn 17.9% of AI Overviews citations, 8.2% of AI Mode, 3.6% of Perplexity and 3.0% of ChatGPT. A single blended number hides all of that.
Social sources show the same split. In Promptwatch's November 2026 social citation data (Oct 11 to Nov 9), social platforms earned 13.16% of AI Overviews citations (YouTube alone 6.71%) versus 1.94% for Perplexity and 0.64% for ChatGPT. If your heatmap puts YouTube visibility next to an engine column, you will see this instantly.
Step 4: add the persona radar
A radar chart plots several metrics (or several personas) on spokes radiating from a center. For AI visibility, the useful version has one spoke per persona and two overlaid shapes: the general audience baseline and the persona in question.
What a persona actually is here
A persona is a way of phrasing prompts. A procurement lead asks about security reviews and contract terms. A solo founder asks about price and setup time. AI engines answer these differently, so your brand can be strong for one buyer and invisible for another. A blended score averages that away.
How to build it
- Define three to six personas you actually sell to. More than six makes the radar unreadable.
- Write the same core prompts in each persona's voice. Keep the underlying intent identical.
- Run them against the same engines and country.
- Plot visibility (or position, or sentiment) per persona as spokes. Overlay the general-audience baseline.
- Look for the persona with the largest gap to baseline. That is where you start.
Promptwatch supports this natively: custom personas, persona stacking, and a radar of visibility, position and sentiment per persona against the general audience, with the biggest gap called out. In a spreadsheet you can reproduce it with a pivot table and a radar chart type, but you will do the prompt tagging yourself.
A caution on small samples
Persona slices cut your sample size by the number of personas. Ten prompts split five ways is two prompts per spoke, and one flipped answer swings the shape wildly. Treat a persona radar as directional until you have enough prompts per spoke and a second period confirms it.
Step 5: add A/B period comparison
This is the widget most dashboards skip and the one executives ask for first: what changed since last time?
The rules for a fair comparison
Brainpan's measurement guide puts it plainly: compare each period against the same baseline and the same competitors, and read rank changes as directional until a second period confirms them. In practice:
- Use full periods of equal length (28 days against the previous 28, not 28 against 40).
- Keep the prompt set frozen during the comparison. If you add 30 prompts mid-period, the change in visibility is partly an artifact.
- Keep the engine and country set identical.
- Keep competitor definitions identical. Adding a rival changes share of voice even if nothing happened in the market.
- Snapshot the numbers. Some tools recalculate history when you edit your setup.
What to put on the A/B view
| Metric | Period A | Period B | Change | Read as |
|---|---|---|---|---|
| Visibility rate | Coverage | |||
| Share of voice | Competitive standing | |||
| Average position | Prominence | |||
| Citation share (own domain) | Content and crawlability | |||
| Sentiment | Reputation |
Reading these together locates the problem. Low share of voice is a coverage problem. Late position is a prominence problem. Mentions without self-citations suggest a content or crawl problem. Weak sentiment is a reputation problem. One number never tells you that.
Pair the chart with the cause
A period comparison tells you something moved. Ask what happened in between: a model update, a rollout, a content publish. Promptwatch Data has examples of sudden shifts, such as reddit.com's share of ChatGPT citations falling from about 4% to 0.5% on August 14, 2026, and ChatGPT starting to use the site: operator at scale on August 8, 2026. If your A/B chart straddles one of those dates, your change may have nothing to do with your own work. Annotate the chart.
Step 6: layer in the supporting widgets
Once the three headline views work, add the context that explains them.
- Top cited domains and URLs, with your own domain highlighted. Self-citation rate (the share of citations pointing at your own site) is a handy single number.
- Top winners and losers: the cited pages that gained or lost the most since the last period.
- Sentiment by topic. Visibility is a vanity metric if the AI is hallucinating or speaking negatively about you.
- Crawler activity, if you have it. If AI bots never reach a page, no amount of content work will get it cited. Promptwatch's AI crawler logs cover this with IP-verified requests.
- AI-referred traffic and conversions, so the dashboard ends in business outcomes and not just mentions.
Keep mentions and citations as two separate widgets. Ahrefs Brand Radar counts a mention once per answer and a domain citation once per answer, and Otterly's export has separate columns for Your Brand Mentioned and Your Domain Cited. Follow that pattern.
Step 7: pick a delivery format
Decide early whether the dashboard is a live link or a PDF, because it changes how you build.
- Live dashboards suit working teams. Some platforms share them by read-only link.
- PDFs suit clients and executives. Otterly produces branded PDFs, Promptwatch exports PDFs of any dashboard (including custom ones) and can schedule them to inboxes, and white-label organizations can brand them.
- Not every tool does both. SE Visible, for instance, did not offer PDF export when its documentation was reviewed for the research behind this guide.
Add one line at the top of every report on what to do next. A dashboard without a recommended action is just decoration.
Tool comparison for dashboard building
| Tool | Custom dashboards | Heatmap | Persona analysis | Period comparison | Notes |
|---|---|---|---|---|---|
| Promptwatch | Yes, with templates | Yes, any axis | Radar per persona | A/B chart | Also covers crawler logs, traffic and content actions |
| Profound | Yes, per-chart filters | Check docs | Check docs | Filters by topic and region | Snapshot your own numbers; edits can alter history |
| Otterly.AI | Reports and exports | Limited | Not a focus | Winners and losers | Branded PDFs; prompt-level export |
| Semrush AI Visibility Toolkit | Via Sheets and an AI assistant | DIY | DIY | DIY | No share of voice for AI engines in Prompt Tracking at time of review |
| SE Visible | Date range vs previous | Check docs | Check docs | Preset or custom | No PDF export yet |
| DIY (Sheets plus Search Console) | Fully custom | Pivot and conditional formatting | Radar chart | Manual | Cheapest, most upkeep |
Capabilities change quickly, so confirm anything critical on each vendor's own pages. For more options, browse the GEO software directory at bestgeosoftware.com.
A weekly routine that keeps the dashboard honest
A dashboard nobody opens is worse than none. A routine that holds up:
- Refresh data on the same weekday.
- Check the A/B view first. Anything that moved more than your noise threshold gets a note.
- Open the heatmap and find the single reddest cell.
- Open the persona radar and find the widest gap.
- Check winners and losers for cited pages that lost ground.
- Write one action. One. Then ship it and check next period.
Watch Copilot in particular on monthly trends rather than weekly ones, given how its source counts swung in Promptwatch's data. And remember that a single-period change is a hint, not a verdict.
Common mistakes
- Blending all engines into one number.
- Changing the prompt set mid-comparison.
- Counting mentions and citations as the same thing.
- Using too many personas for too few prompts.
- Reporting a score without a next step.
- Forgetting that a page can be cited 50 times by AI and still earn zero Google clicks, so check both sides.
Which route should you take?
If you have one brand, one market and a spare afternoon, build it in Sheets. You will learn what the metrics mean. If you have several markets, an agency's worth of clients, or you need persona and period views to stay consistent every week, use a platform that holds the structure for you. Promptwatch's free AI visibility report is a no-login way to see baseline numbers, and there is a 7-day free trial on monthly plans if you want to test the dashboard builder on real data. Confirm current plans at promptwatch.com/pricing.
If you are choosing between tools more broadly, the directory at ai-rank-tools.com lists AI rank trackers side by side.