Key takeaways
- Visibility Score measures presence: how often your brand shows up in AI answers. Perception measures quality: how AI describes you and whether it is right.
- "AI Perception Score" has no standard definition. Visibility Score does not either, since vendors calculate it differently, so state your definition in every report.
- Lead with Visibility Score as the trend line, then pair it with share of voice and a perception or sentiment measure so no number is read out of context.
- Neither metric is a business outcome. Pair both with traffic, conversions, or pipeline evidence.
- Annotate every chart with platform changes. AI engines shift behavior overnight, and leadership should not read a model update as a team failure.
The short answer
Report both, but not as equals. Visibility Score is the headline because it is simple, trendable, and the closest AI equivalent to impressions. Perception is the explanation underneath it, and it matters most when the headline number looks fine but deals are going sideways.
If a leadership team gives you one slide, put Visibility Score on the left, share of voice next to it, and a perception readout below. Then add one line that connects to revenue. That layout answers the three questions executives actually ask: are we showing up, are we winning against competitors, and is what AI says about us true and helpful?
The rest of this guide covers definitions, where each metric breaks, and how to build the report.
What Visibility Score actually measures
There are two common definitions, and mixing them up causes most of the confusion in leadership meetings.
The simple version is the percentage of tracked prompts where your brand appears. Cognizo's guide to AI visibility metrics gives the example: track 200 prompts in your category, appear in 60, and your Visibility Score is 30%. It recommends reporting it as a trend, because direction tells you more than any single reading.
The weighted version is a composite. Adobe's documentation says visibility score is an aggregate and that every tool calculates it differently. Adobe Brand Visibility weights mentions, citations, position, and sentiment into one number.
The practical consequence: a score of 38 in one tool and 38 in another are not the same thing. You cannot benchmark across vendors, and you should not paste a vendor score into a board deck without a footnote explaining what is inside it.
Promptwatch uses the weighted approach. Its Visibility Score runs 0 to 100, with each response scored on placement, share of attention, and depth, then averaged. Responses that do not mention the brand count as zero. The Visibility Score definition in the Academy spells this out, which is the kind of documentation you want from any vendor before you quote its number upward.
Where Visibility Score is strong
- It is easy to explain. Executives understand "we appear in 30% of buyer questions."
- It trends well. Week over week and month over month, direction is meaningful.
- It is segmentable by platform, topic, country, and funnel stage.
Where it misleads
- A blended number hides everything. Cognizo calls reporting one blended figure the common mistake. You can lead on ChatGPT and trail on Perplexity for the same prompts, and the average buries both facts.
- It says nothing about tone. A brand can appear often and be described as expensive, outdated, or lacking features.
- It depends on the prompt set. Change the prompts and you change the score.
- It is a north star that is hard to act on alone, which is Adobe's own framing.
What "AI Perception Score" means (and why you must define it)
I could not find a single authoritative definition of AI Perception Score. Vendors and agencies use the phrase for slightly different things, so treat it as a label you own rather than a standard you inherit.
The most useful working definition combines three components:
- Sentiment: is the tone of AI answers about you positive, neutral, or negative?
- Positioning accuracy: does AI describe what you do, who you serve, and how you are priced correctly?
- Recommendation strength: when AI names you, does it recommend you, list you neutrally, or warn against you?
That third part matters more than people expect. One source in the research, BrandViz, calls Recommendation Rate the highest-value component of its visibility score. Being mentioned in a list of ten is different from being the answer.
In Promptwatch terms, the closest equivalents are the Sentiment score (0 to 100, with roughly 50 neutral, scored independently of visibility) and Brand Narrative, which pulls out the individual claims AI makes about you, groups repeated ones, and files them under themes like Pricing, Features, Support, and Reputation with a 0 to 100 score per theme. Those give you a perception number you can defend, because each score traces back to specific claims.
Why perception deserves its own line
Visibility can rise while perception falls. Imagine you publish a lot of comparison content and start appearing in more answers. Visibility Score climbs. But the new answers repeat a claim that your support is slow, because that claim lives in a review site the model trusts. Your dashboard looks great and your pipeline softens.
That is the scenario where a visibility-only report fails leadership. It is also the scenario where a perception-only report fails them in reverse: glowing sentiment in answers nobody sees.
Side by side comparison
| Question | Visibility Score | Perception score |
|---|---|---|
| What it answers | Are we named? | What is said about us, and is it right? |
| Typical unit | % of prompts, or 0-100 composite | 0-100 sentiment or theme score |
| Closest SEO analogy | Impressions | Brand reputation and SERP snippets |
| Standard definition | No, varies by vendor | No, varies even more |
| Best for | Trend line, coverage gaps | Reputation risk, messaging gaps |
| Main failure mode | Hides tone and accuracy | Looks good when reach is tiny |
| Fix when it is weak | More coverage: content, citations, crawlability | Better source material, corrected claims, third-party mentions |
| Audience that cares most | CMO, growth, board | Brand, comms, product marketing |
One diagnostic rule from Promptwatch's metrics framework is worth borrowing: read the numbers together to locate the problem. Low Share of Voice is a coverage problem. Late Position in answers is a prominence problem. Mentions without citations to your own domain point to a content or crawlability problem. Weak sentiment is a reputation problem. Each one needs a different owner and a different fix.
Which metric for which audience
Different leaders want different things, and one deck rarely serves all of them.
The board and CEO
They want direction and a competitive frame. Give them Visibility Score trend, share of voice versus two or three named competitors, and one business outcome. Skip methodology unless asked, but keep it in an appendix.
The CMO
They need the split by platform, topic, and funnel stage, plus the perception readout. This is where the heatmap view earns its place: brands on one axis, models or topics on the other, colored by visibility or sentiment.
Brand, comms, and PR
They care about perception first. The relevant research comes from the PR side: one LinkedIn framework from Gini Dietrich names four metrics, including LLM visibility, citation frequency, narrative share of voice, and credibility loop close rate.
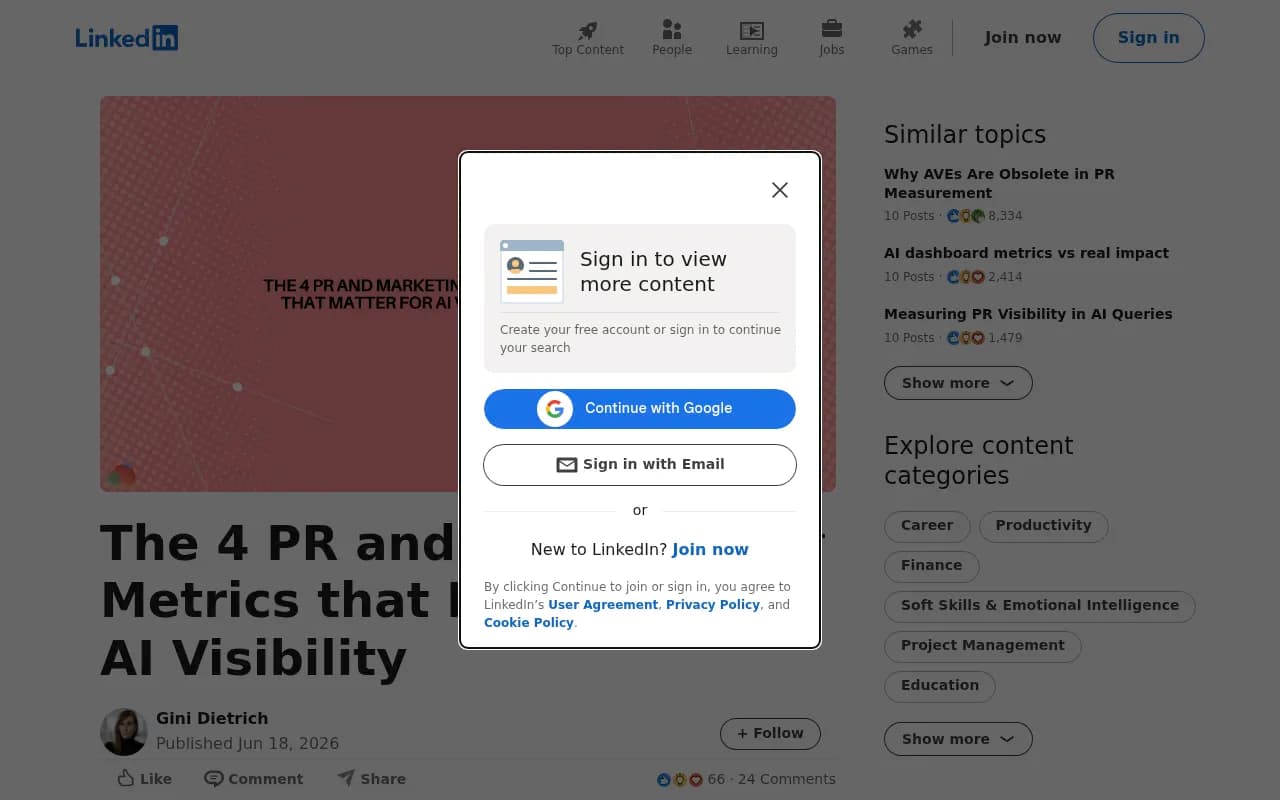
Narrative share of voice is effectively a perception metric: what share of the story about your category is told in your terms.
Product marketing and sales leadership
They want to know which claims AI makes about pricing, features, and competitors, and whether those claims are accurate. A fact-check workflow is more useful to them than any score. Promptwatch's Fact Check, for example, lets you mark a claim accurate or inaccurate and then identifies which crawled pages on your site state it or its opposite.
The reporting problem nobody warns you about: the platform moves under you
Before you commit to a monthly scorecard, understand that the thing being measured is unstable.
Promptwatch Data tracked what happened when ChatGPT rolled out GPT-5.3 on March 4, 2026. The average number of citations per search-enabled response fell from about 6.4 in the week before to roughly 4.7 to 4.9 by late March, around 27% fewer citation slots, with no recovery a month later. The drop hit GPT-5.3, GPT-5.4, and GPT-5-Mini at the same time. If your visibility dipped that week, the cause was probably the platform, not your team.
A second example: Promptwatch's ChatGPT query fanout data showed average web searches per response at 2.15 in early December 2025 and about 1.84 by early March 2026, with average fanout query length falling from about 117 characters to the high 80s. A fixed prompt set therefore measures a different retrieval behavior over time.
What to do about it:
- Annotate charts with model releases and platform changes.
- Track citations per response next to your own visibility so you can separate "we lost ground" from "everyone lost slots."
- Prefer trends over snapshots. A single audit is unreliable.
- When a dip appears, check the date against platform changes before reporting it as a problem.
This matters more for perception than people assume. Sentiment shifts when the sources a model draws from shift, which is outside your control in the short term.
A reporting template that holds up
Here is a structure I would use for a monthly leadership report. It fits on two slides.
Slide one: the headline
| Metric | Current | Prior period | Note |
|---|---|---|---|
| Visibility Score (state definition) | Annotate platform changes | ||
| Share of voice vs named competitors | Same prompt set both periods | ||
| Perception (sentiment plus accuracy) | Top 2 claims moving | ||
| AI-referred visits and conversions | From analytics, not the tool |
Slide two: the so-what
- Where we are strong and weak, by platform and by topic.
- The top three claims AI makes about us, and whether they are accurate.
- The two or three actions for next month, with owners.
Rules that keep the report honest
- Name the definition. One line: "Visibility Score is the weighted average of placement, share of attention, and depth across N prompts on these platforms."
- Freeze the prompt set, or log every change to it. Otherwise your trend is partly an artifact.
- Segment before you average. Never show only the blended figure.
- Separate signal from outcome. Cast Influence puts it well: track visibility to learn where the brand is showing up, and track business evidence to learn whether that presence creates value. Your AI visibility score matters, but it is not the business outcome.
- Show the buyer questions underneath. Leaders should see which prompts sit behind the number and which buying stages they represent.
On that last business-evidence point, click-based referral traffic is an imperfect measure because many AI answers include no clickable link. Still, trendable AI-referred visits and conversions are the best bridge to revenue you have. Promptwatch's guide on attributing AI traffic covers the practical setup, including the fact that ChatGPT stopped sending a referrer on October 8, 2026, so tagged links (utm_source=chatgpt.com) are now worth counting.
Benchmarks: use them cautiously
You will find tables that say 70+ is dominant, 30 to 49 is moderate, 20 to 29 is weak, and below 20 is high exclusion risk. The BrandViz guide publishes exactly that. It is a useful sanity check for that vendor's own scoring model and almost meaningless for anyone else's, given the definition problem above.
A better benchmark is relative. Where do you sit against three named competitors on the same prompts, on the same platforms, in the same period? Share of voice answers that directly. A Visibility Score of 30% could be strong or weak depending entirely on where competitors sit.
Tools that help you track both
Most AI visibility tools report some version of visibility. Fewer give you a perception layer you can trace to claims, and fewer still connect either one to traffic and content actions. A rough guide:
| Tool | Visibility measurement | Perception or sentiment | Beyond monitoring |
|---|---|---|---|
| Promptwatch | 0-100 Visibility Score, Share of Voice, Position | Sentiment score, Brand Narrative, Fact Check | Crawler logs, visitor analytics, Content Agent, Action Board |
| Adobe Brand Visibility | Weighted composite of mentions, citations, position, sentiment | Included in composite | Enterprise suite integration |
| Profound | Enterprise visibility tracking | Yes | Higher price point |
| Otterly.AI | Prompt-level tracking | Basic | Light on execution |
| Peec AI | Monitoring | Basic | No optimization layer |
Promptwatch is the one I would shortlist if the goal is a report that connects score to cause to fix, since the same product shows the Visibility Score, the claims behind the sentiment, which pages AI crawlers read, and whether published content earned citations and visits. Pricing starts at $95/month for Essential, with Fact Check and the Content Agent arriving at the Business tier ($579/month); confirm current details at promptwatch.com/pricing. A free AI visibility report is a no-login way to see your baseline first.
If you are still choosing, the GEO software directory at bestgeosoftware.com lists far more options than this table can cover.
Common mistakes when reporting these metrics
- Quoting a vendor score as if it were an industry standard.
- Reporting a single blended number across all platforms and topics.
- Celebrating visibility growth without checking what the new answers say about you.
- Treating a platform-wide dip as a team failure. Compare against the citation-per-response baseline first.
- Changing the prompt set mid-quarter and not saying so.
- Presenting perception as a precise number when it is built from small samples. Handraise makes the point that dashboards can make small prompt tests look like full measures of brand reputation. Show sample sizes.
- Skipping the business line. A score with no outcome beside it invites the question "so what?" and you will not have an answer.
The recommendation
If you must pick one: Visibility Score, defined clearly and shown as a segmented trend. It is the better headline because it is simple, repeatable, and maps to an idea leaders already understand.
But treat it as the first column, not the whole table. Add share of voice so the number has context. Add a perception measure so you notice when presence turns harmful. Add one traffic or conversion line so the report ends on business evidence rather than a score.
And write the definitions down. In a field where every vendor computes these numbers differently and the platforms rewrite their own behavior without notice, the definition is the part of your report that makes it trustworthy.
Teams that want help building this kind of reporting into a wider search program can also look at agencies that handle GEO end to end. 1001 SEO Media, which publishes this site, does this work and uses Promptwatch as its AI visibility platform.