Key takeaways
- A monthly AI report should answer three questions: where did the brand appear, did anyone reach the site, and what changes next.
- Do not invent a composite "AI score". Google AI impressions, Bing AI citations, assistant sessions and prompt-panel results are different events. Report each with its own source, window and denominator.
- Lead with a trend, then citations won and lost, competitor movement, actions taken and next bets. Every metric must connect to a decision.
- State the time window on every number. Comparing a 7-day report to a 30-day report is the most common way to mislead a client without meaning to.
- If you have no baseline, make month one a baseline. Do not announce a percentage gain against nothing.
Why client reports for AI search are harder than SEO reports
Rankings and clicks translate badly to AI answers. An AI response names a handful of brands, often resolves the question without a click, and changes depending on the model, the country and the day. A client who gets a screenshot dump of a dashboard cannot tell whether the number is good, what moved it, or what you plan to do.
Menra's guide puts the job plainly: convert data into a story. Here is where you stood, here is what moved, here is what we did, here is what we are doing next. I would add one rule that I think matters more than any chart: if a metric does not connect to an action or a decision, cut it.
The measures that belong in the report, and what each one means
BrandJet's template is the most careful I have seen about this. It separates four things that people routinely blur together:
- Google Generative AI impressions, from Search Console. A reported impression in AI Overviews or AI Mode. Not a visit, not a prompt.
- Bing AI citations, from Bing Webmaster Tools. A visible reference in a supported Bing or Copilot experience. Not a click or a ranking position.
- AI Assistant sessions, from GA4 Traffic acquisition. Sessions classified from recognized assistant referrers. Anything that arrives without a referrer is missing from this number.
- A controlled prompt panel, reported as brand inclusion count over total tested prompts, compared with the same panel last period.
The prompt panel is where perception lives. The other three tell you about exposure and traffic. Only a fixed set of prompts, run the same way each month, tells you what AI says about the brand and whether that is changing.
Add perception metrics to the panel
Inclusion alone is thin. A brand can be included and described badly, or listed ninth. For the perception layer, add these per prompt group:
- Mention rate: share of responses that name the brand.
- Position: where the brand lands among the brands in the answer.
- Sentiment: how the answer describes it, scored the same way each month.
- Claims: the specific statements AI makes ("affordable for small teams", "weak support") and whether each is accurate.
- Citations: which of the client's URLs, and which third-party pages, the answer relies on.
- Competitors present in the same answers.
Promptwatch data supports reporting position and context, not just a yes or no. In Promptwatch Data's analysis of unique domains per ChatGPT response (Sep 28 to Oct 4, 2026), 47.6% of responses with citations cited 10 or more domains, and 66.1% cited at least 8. Answers are crowded. Being one of ten sources is a different result from being the lead recommendation, and your report should say which.
The five-section monthly template
Use the same structure every month so the client learns to read it in two minutes.
- Executive summary: one observed change, one limitation, one business implication.
- Perception trend: mention rate, position and sentiment on the controlled panel, month over month, with a target line.
- Citations won and lost: specific URLs, and on which engines.
- Competitor movement: the same measures for two or three rivals.
- Actions taken and next bets: what you shipped, what you plan, and the hypothesis behind each move.
| Section | What goes in | Source and window to state | Client question answered |
|---|---|---|---|
| Executive summary | One finding, one limit, one implication | All sources, report month | What happened? |
| Perception trend | Mention rate, position, sentiment | Fixed prompt panel, same models and markets | Are we showing up and how are we described? |
| Google and Bing exposure | AI impressions, AI citations | Search Console, Bing Webmaster Tools, 30 days | Where do we appear in search AI? |
| Traffic | AI Assistant sessions, key events | GA4, report month | Did anyone arrive? |
| Citations | URLs won and lost per engine | Prompt panel plus citation data | What is driving it? |
| Competitors | Rival mention rate and position | Same panel | Are we gaining ground? |
| Actions and next bets | Work shipped, planned moves | Agency log | What did you do, what is next? |
A copyable one-page summary
Paste this at the top of the document and delete any row your tools cannot measure.
AI visibility report: [Client] | [Month and year]

Scope: [Markets], [language], [products], [models or search surfaces]
Executive finding: [One observed change, one limitation, one business implication]
Google AI Search visibility: [Impressions, period, % change, source]
Bing AI citations: [Total citations and cited URLs, period, source]
Assistant referrals: [GA4 AI Assistant sessions and named key events, period]
Controlled prompt panel: [Brand inclusion count] / [Total tested prompts], vs same panel last period
Perception: [Position, sentiment, top 2 claims AI makes about the brand]
Most material page: [URL and why it matters]
Action approved for next month: [One page or entity correction, owner, due date]
Measurement caveat: [What these data cannot prove]
Write the executive finding as an observation, not a victory adjective. "Google AI Search impressions rose on three help pages, while assistant referrals stayed too small to interpret" is useful. "We dominated AI search" is not, and clients who have been burned once will notice.
A hypothetical readout
BrandJet's example is deliberately labeled as hypothetical, and I would do the same in any sample you show: 8,000 Google Generative AI impressions, 1,200 Bing AI citations and 42 GA4 AI Assistant sessions in September. Three different units, three different sources. Adding them up would produce a meaningless number. Showing them side by side produces a story: decent exposure, thin traffic, so the next question is whether the cited pages invite a click.
Segment the panel before you report it
A single blended mention rate hides the interesting parts. Split the prompt panel by intent and by model.
Promptwatch Data's ChatGPT citation share by content type (Sep 28 to Oct 4, 2026) shows why. Product pages were 22.4% of citations overall, but 26.0% for commercial prompts and 23.3% for branded prompts, while how-tos reached 10.7% for informational prompts. The pages that earn citations differ by intent, so a client with strong how-to content and weak product pages will look fine on informational prompts and poor on commercial ones. A blended number would average that away.
The same logic applies to engines. Social sources are a good example. In Promptwatch Data's November 2026 social citation report (Oct 11 to Nov 9, 2026), social platforms earned 13.16% of Google AI Overviews citations, 1.94% of Perplexity's and 0.64% of ChatGPT's. A client investing in YouTube may see results in AI Overviews and nowhere else, and the report should say so by engine.
State the window, every time
That same social data carries a warning for report writers. The October report covered 7 days and the November report covers 30. Put them side by side and ChatGPT's social share appears to rise from 0.46% to 0.64%, but the windows are not like for like. If a client's report did this, you would be reporting noise as movement.
A few habits prevent it:
- Print the date range and sample size under every chart.
- Compare the same window length to the same window length.
- Keep the prompt panel fixed. If you add or remove prompts, mark the break in the trend line.
- Use the first month as a baseline when there is no controlled history.
Annotate changes the client did not cause
Some movement has nothing to do with your work. Good reports mark it so the client does not credit or blame the agency wrongly.
- Promptwatch Data recorded reddit.com's share of ChatGPT citations falling from about 4% to 0.5% on August 14, 2026. Any client whose perception depended on Reddit threads moved that day for reasons unrelated to content.
- Average citations per ChatGPT response dropped around the GPT-5.3 rollout on March 4, 2026. A model change can lower every brand's citation count at once.
- ChatGPT began using the site: operator at scale on August 8, 2026, per Promptwatch Data, jumping from about 0.4% to about 17% of fanout queries. Retrieval behavior changed overnight.
A short "platform changes this month" line in the executive summary costs you nothing and protects the relationship.
Re-check cited pages on a monthly cycle
Cited content does not stay cited. In Promptwatch Data's content half-life study, which tracked pages ChatGPT cited on July 6, 2026 for 90 days, landing pages and docs stayed cited longest while news lost half its pages within 36 days. That is a good argument for monthly cadence and for the citations won and lost section: the list of cited URLs is a moving target, and a quiet month for a news-heavy client can be decay rather than failure.
Cadence is a judgment call. Cognizo recommends monthly as the sensible default, with biweekly for fast-moving categories or an active optimization push. Demand Local suggests a tiered rhythm: daily or weekly monitoring internally, monthly for the client report, quarterly for strategy.
Actions and next bets: the part that justifies the retainer
Clients can get dashboards anywhere. What they are paying for is the decision. Close every report with a short queue:
- Shipped this month: pages published, schema added, entities or facts corrected, third-party mentions earned.
- Approved for next month: one or two moves with an owner and a due date.
- Hypothesis: what you expect to change in the panel and when you will know.
Keep it small. One page or entity correction with a named owner beats a list of twelve vague intentions.

Tools that can feed the report
The template works with any data source, but a few categories of tool make it repeatable.
Promptwatch is the one I would look at first for the perception layer, because it covers monitoring, tracing, acting and measuring in one place. It runs a fixed prompt panel across ChatGPT, Gemini, Perplexity, Google AI Overviews and others using the real interfaces, scores Visibility, Position and Sentiment, and its Brand Narrative feature pulls out the individual claims AI makes about the brand, which maps directly onto the claims row in the template. Agencies can see the agency plans and confirm pricing at promptwatch.com/pricing.
For the free exposure data in the template, Google Search Console is the source for Generative AI impressions.
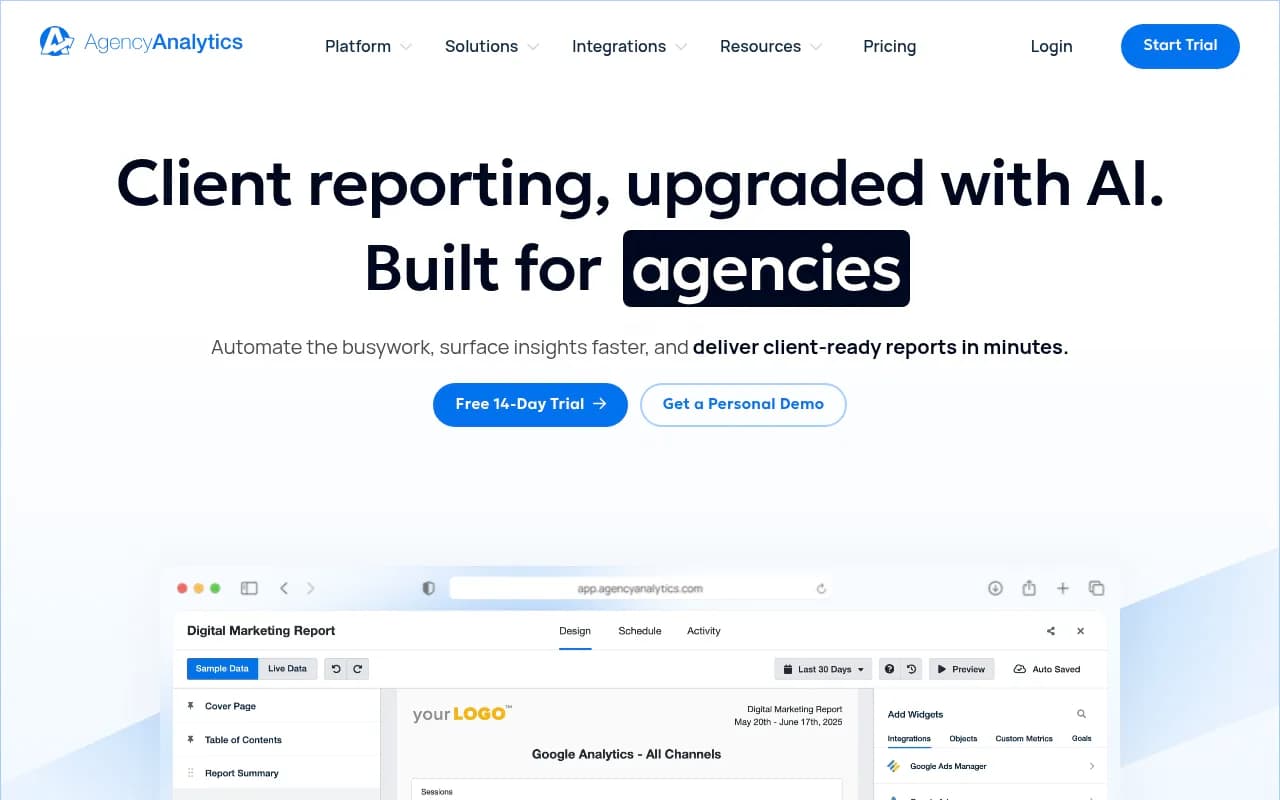
If your agency already assembles client documents with a reporting tool, AgencyAnalytics can host the traffic and search portions alongside the AI sections.
| Job in the template | Tool type | Examples from the catalog |
|---|---|---|
| Controlled prompt panel, sentiment, claims | AI visibility platform | Promptwatch, Profound, Peec AI, Otterly.AI |
| Google AI impressions | Search data | Google Search Console |
| Assistant referral sessions | Web analytics | GA4 (Traffic acquisition) |
| Client-ready document assembly | Reporting platform | AgencyAnalytics |
For a wider shortlist of trackers, the directory at ai-rank-tools.com lists AI rank and visibility tools side by side.
Common mistakes to avoid
- Collapsing everything into one invented score. It hides the units and cannot be defended when a client asks how it was calculated.
- Reporting a single prompt. One response tells you almost nothing, and answers vary run to run.
- Counting mentions without reading them. A mention with a wrong claim is a problem, not a win.
- Letting the prompt panel drift. Quietly swapping prompts breaks every trend line.
- Hiding the caveat. Assistant sessions undercount because some AI visits arrive with no referrer. Say that in the report before the client finds it.
- Claiming causation. "We published the page and mention rate rose" is a correlation. Write it that way.
A first-month checklist
- Agree the scope: markets, languages, products, engines.
- Build a prompt panel split by intent: commercial, informational, branded, competitor comparison.
- Record the baseline for mention rate, position, sentiment and top claims.
- Pull Google AI impressions, Bing AI citations and GA4 assistant sessions, each with its own window.
- Choose two or three competitors to track on the same panel.
- Draft the one-page summary and label month one as a baseline.
- Agree one action for next month, with an owner and a date.
From month two onward the report writes itself, because the structure never changes and only the findings do.
If you would rather hand the work to a team, the agency that publishes this site, 1001 SEO Media, runs AI search and GEO engagements with transparent monthly reporting built on this kind of structure.