Key takeaways
- Visibility score, share of voice, position and sentiment each answer a different question. Read them together, never alone.
- Low share of voice is a coverage problem. Late position is a prominence problem. Weak sentiment is a reputation problem.
- Compare engines separately. ChatGPT cites about 5 sources per web-search answer, while Google AI Overviews and Perplexity cite about 10, so a mention is worth different amounts in each.
- A sudden drop is often an engine-side change, not something you did wrong. Check trends over weeks, not single days.
- Numbers only matter if they lead to action: fix crawl access, fill content gaps, or repair how third parties describe you.
Why AI visibility dashboards confuse people
Open an AI visibility dashboard for the first time and you get a wall of percentages, trend lines and heatmaps. Nothing is labeled "good" or "bad". A visibility score of 42 could be excellent in a crowded category or a disaster in a niche one.
The confusion is mostly about definitions. Vendors use similar words for slightly different calculations, and the metrics are new enough that there is no shared standard like there is for bounce rate or CTR. So the first rule is to read the methodology page of whatever tool you use. The second rule is what this guide covers: what each metric is trying to tell you, and how to combine them.
I'll use the definitions from Promptwatch as the running example, since it publishes its metric logic openly, but the reasoning applies to most tools in this category.
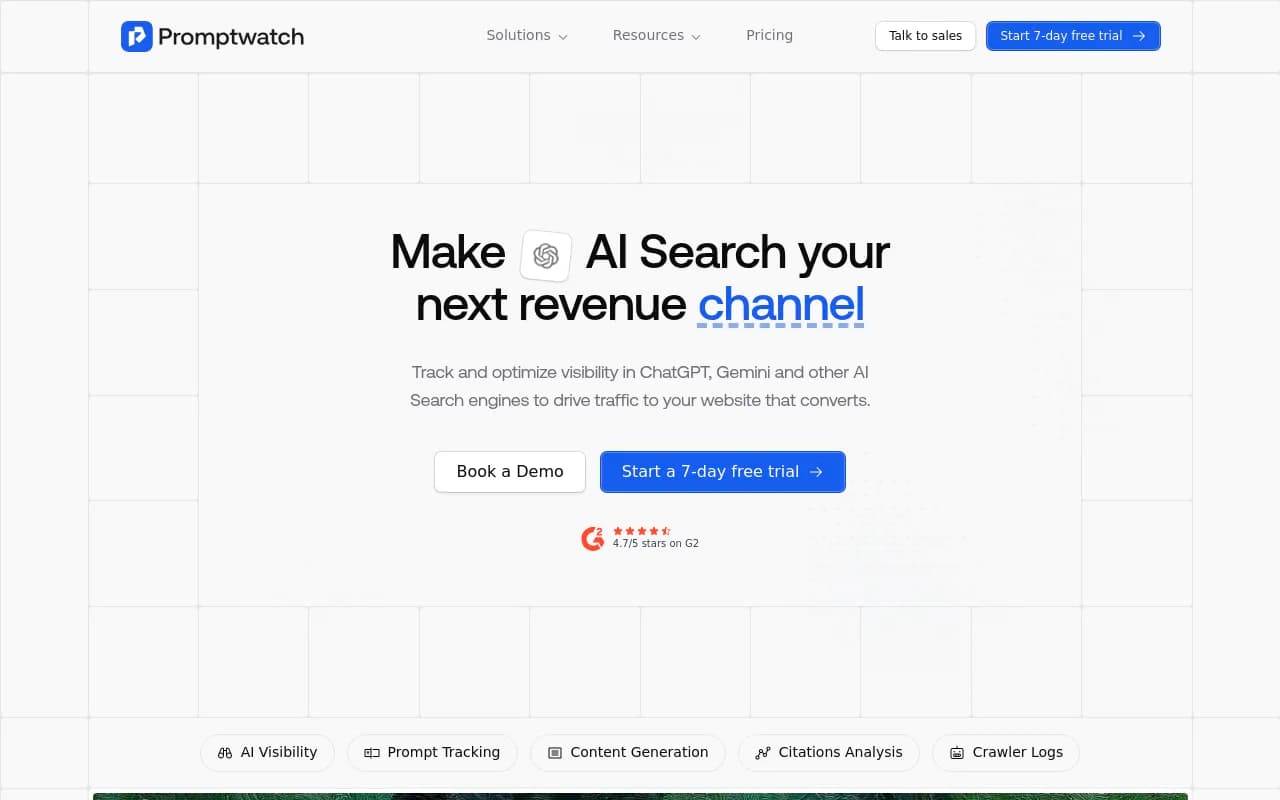
What an AI visibility dashboard is actually measuring
Under the hood, nearly every tool works the same way. You define a set of prompts, the kind of questions your customers ask AI assistants. The tool runs those prompts on a schedule across models like ChatGPT, Perplexity, Gemini and Google AI Overviews, stores the answers, and extracts three things from each: whether your brand was mentioned, where, and what was said about it. Citations (the source links) are tracked alongside.
Everything on the dashboard is an aggregate of those stored answers. That has two consequences worth keeping in mind:
- The numbers depend entirely on your prompt set. Track 20 branded prompts and your score will look wonderful and mean little.
- AI answers vary run to run. A single response is an anecdote. Hundreds of responses over weeks are a signal.
One more thing: where the data comes from matters. Promptwatch says it collects from the actual user interfaces of ChatGPT, Gemini, Perplexity, Claude, AI Overviews and others rather than only APIs, because what users see can differ from API output. If a tool only uses APIs, treat its numbers as a model-level view, not a user-level one.
Visibility score
The visibility score is the headline number, usually 0 to 100. In Promptwatch it is built from placement, share of attention and depth, so it rewards being mentioned early, prominently and in detail, not just being named somewhere.
How to read it
Treat it as a thermometer, not a diagnosis. It tells you whether you are warm or cold overall and whether the trend is moving. It does not tell you why.
- Compare it against competitors on the same prompt set, not against an abstract benchmark.
- Track it by topic. A brand with a 70 overall might have a 15 on the one topic that drives revenue.
- Ignore day-to-day wiggles. Watch the 4 to 8 week direction.
The common trap
Because it blends several factors, two brands can hit the same score for opposite reasons: one is mentioned often but buried, the other rarely but prominently. That is why you drill into the components below.
Share of voice
Share of voice is your slice of all brand mentions across the tracked prompts. If AI answers name five brands in your category and you appear in a quarter of the mentions, your share of voice is 25%.
What it tells you
It is the coverage metric. Low share of voice means AI models are not reaching for you when the topic comes up, which usually points to missing content, weak third-party coverage, or crawlers that cannot read your pages.
How to use it
- Pair it with the competitor list. Share of voice only makes sense relative to who is in the denominator, so check that auto-discovered competitors are the ones you actually compete with.
- Break it down by prompt type: organic category questions, brand-specific prompts and competitor comparisons behave very differently. Branded prompts should be near 100% for you. Organic ones are where the real fight is.
- Slice it by country and language if you sell in more than one market.
Position
Position is where your brand appears inside the answer. First in a recommended list is worth far more than fifth, and a brand mentioned only in the closing paragraph barely registers with a skimming reader.
A related number is citation rank, which is where your domain lands in the source list. These are different things: you can be named first in the text but have your own site listed ninth in the sources, or vice versa.
Reading position correctly
Late position with decent share of voice is a prominence problem. The model knows you exist but does not consider you the best fit. That is usually fixed with clearer positioning, stronger comparison content, reviews and evidence on third-party sites, and pages that answer the specific sub-question directly.
Why engines are not interchangeable
Promptwatch Data on average sources per response shows ChatGPT citing about 5 sources per web-search answer, Google AI Overviews about 10, and Perplexity almost exactly 10 every day. Copilot swung from under 2 to nearly 17 within a few weeks before settling low. The practical implications:
- A ChatGPT citation is scarcer than one of ten slots in AI Overviews, so it deserves more weight.
- Never read a single blended position number. Look per engine.
- Perplexity is a steady test bench. Because its output barely moves, changes in your numbers there more likely reflect your content than engine noise.
- Judge Copilot on monthly trends, not weekly snapshots.
Sentiment
Sentiment scores how the AI describes you, typically 0 to 100 with roughly 50 meaning neutral. It is computed per response and then trended.
What it tells you
Sentiment is the reputation metric. A brand can have great share of voice and still lose if the answers say "cheap but unreliable" or "popular, though users complain about support".
How to use it
- Do not obsess over the absolute number. Neutral is normal, since most answers are factual lists.
- Look at the drivers. Good tools show a weekly summary or the specific phrases behind a drop. Those phrases usually trace back to a few third-party sources: review sites, Reddit threads, old articles.
- Compare against competitors by topic. A sentiment heatmap by topic shows exactly where you are weak, for example pricing or support.
The fix is rarely on your own site. You change sentiment by fixing the sources the models learn from and cite, which means reviews, forums, comparison pages and press.
Reading the four metrics together
The real skill is combining them. This table is the cheat sheet I use.
| Pattern you see | Likely problem | Where to look next |
|---|---|---|
| Low share of voice, any position | Coverage gap | Content gap analysis, missing topics, crawler access |
| Decent share of voice, late position | Prominence | Comparison pages, evidence, third-party reviews |
| Mentions but few citations to your domain | Content or crawlability | Crawler logs, page structure, whether pages answer the sub-question |
| Good visibility, weak sentiment | Reputation | Review sites, forums, outdated articles AI is citing |
| High everywhere on one engine, low on another | Engine-specific retrieval | Per-engine citation sources and prompts |
| Sudden drop across all brands | Engine change | Check if competitors dropped too before changing anything |
That last row matters more than people expect. When ChatGPT shifted its behavior, for instance, citation patterns moved for everyone at once. Promptwatch Data tracked how reddit.com's share of ChatGPT citations fell from about 4% to 0.5% on August 14, 2026. If your Reddit-driven visibility fell that week, the cause was not your content.
Why prompt-level scores depend on fan-outs
Another wrinkle: AI assistants often split one question into several web searches, called query fan-out. Promptwatch's ChatGPT query fanout data showed average fanouts per response of 2.15 in early December and about 1.84 by early March, with query length shrinking from roughly 117 characters to the high 80s. Later, ChatGPT began using the site: operator heavily: site: queries jumped from about 0.4% to about 17% of fanout queries on August 8, 2026.
What this means for dashboard reading: your content has to match one of the generated sub-queries, not just the user's original prompt. If your visibility score on a prompt is low, look at the fan-outs. The answer is often that nothing on your site matches the sub-queries the model actually runs.
Common mistakes when reading dashboards
Reacting to single-day moves
AI answers are non-deterministic. A two-point swing on 50 prompts is noise. Wait for a trend across several weeks, and require a consistent direction across multiple engines before you act.
Tracking too few or the wrong prompts
A dashboard built on 10 brand-name prompts is a vanity report. Build monitors around real buyer questions: category questions, comparisons, problems, and use cases. Prompt volume and difficulty data, where your tool has it, helps you choose.
Blending engines and countries
One blended number hides the story. Split by model, country and language before drawing conclusions.
Treating mentions as business impact
Visibility is an input. What you care about is traffic and conversions. This is where crawler logs and visitor analytics help: they show whether AI systems actually read your pages and whether people click through. Mentions with zero AI-referred traffic is a finding in itself.
Ignoring the denominator
Share of voice changes when a new competitor enters the tracked set. Check that a drop is not simply a new brand being added or auto-discovered.
A weekly routine for reading your dashboard
- Start with visibility score by engine. Note any engine that moved more than usual.
- Check whether competitors moved too. If yes, suspect an engine change and wait.
- Open share of voice by topic. Find the single topic with the largest gap to the leader.
- Look at position and citation rank for that topic. Decide whether it is a coverage or a prominence problem.
- Scan sentiment drivers for new negative phrases and the sources behind them.
- Turn each finding into a task: a page to write or refresh, a crawler error to fix, a review profile to improve.
- After shipping, check whether the page is crawled, cited and driving visits. If it is not, it goes back on the list.
Tools that bundle this loop save time. Promptwatch, for example, has an Action Board that turns findings into a prioritized to-do list, and its Agent Chat lets you ask questions of your own data. But the routine works with a spreadsheet and patience too.
Choosing a tool whose dashboard you can trust
The category is crowded. Some tools are pure trackers, some add optimization and content workflows. The questions to ask before you commit:
- Does it query real user interfaces or only APIs?
- Can you see the raw responses behind every number?
- Are visibility score and sentiment methodologies documented?
- Does it split by engine, country and prompt type?
- Does it show crawler activity and AI-referred traffic, or only mentions?
- Can it help you act, not just watch?
| Tool | Type | Notes |
|---|---|---|
| Promptwatch | Tracking plus optimization | Real-UI tracking, crawler logs, visitor analytics, content agent |
| Profound | Enterprise monitoring | Strong tracking, higher price point |
| Otterly.AI | Prompt tracking | Lightweight and affordable |
| Peec AI | Prompt tracking | Monitoring without the optimization layer |
| Semrush | SEO suite | AI tracking added to a traditional suite |
| Ahrefs Brand Radar | SEO suite | Brand monitoring in AI search |
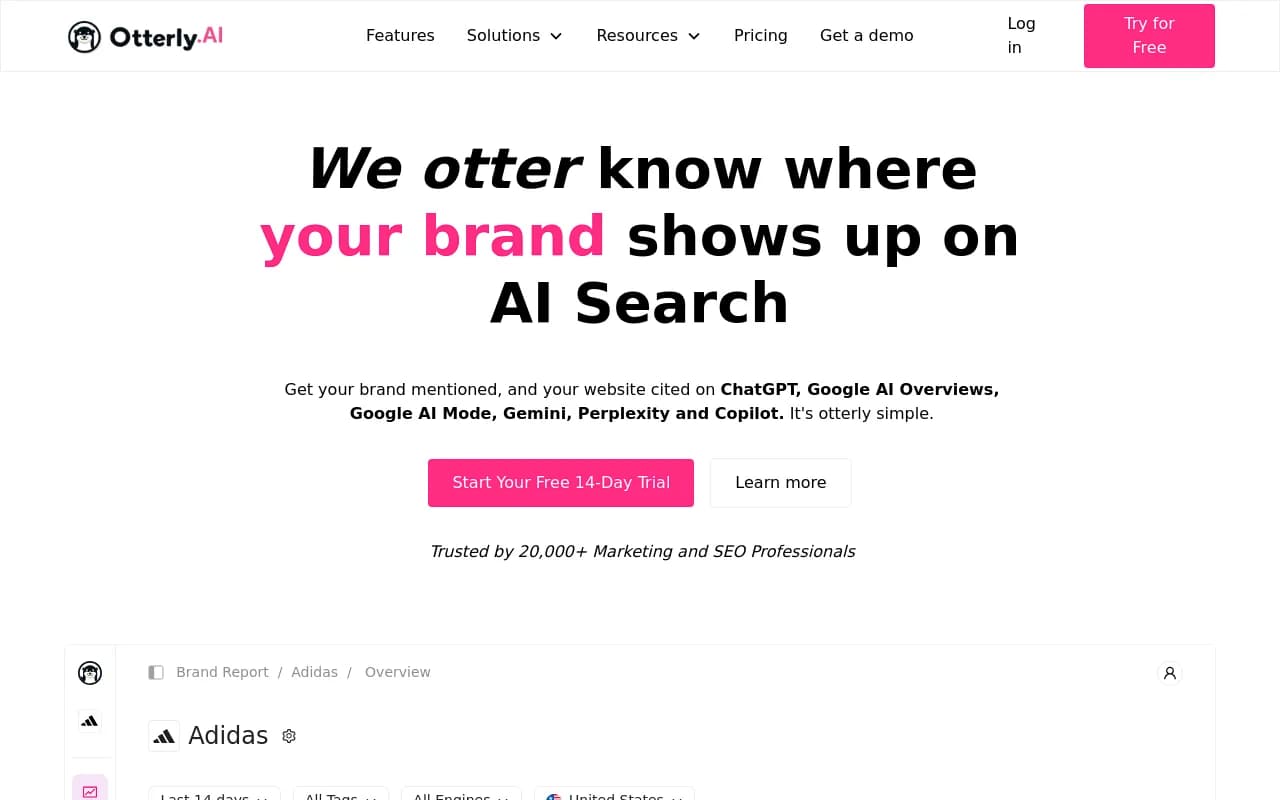
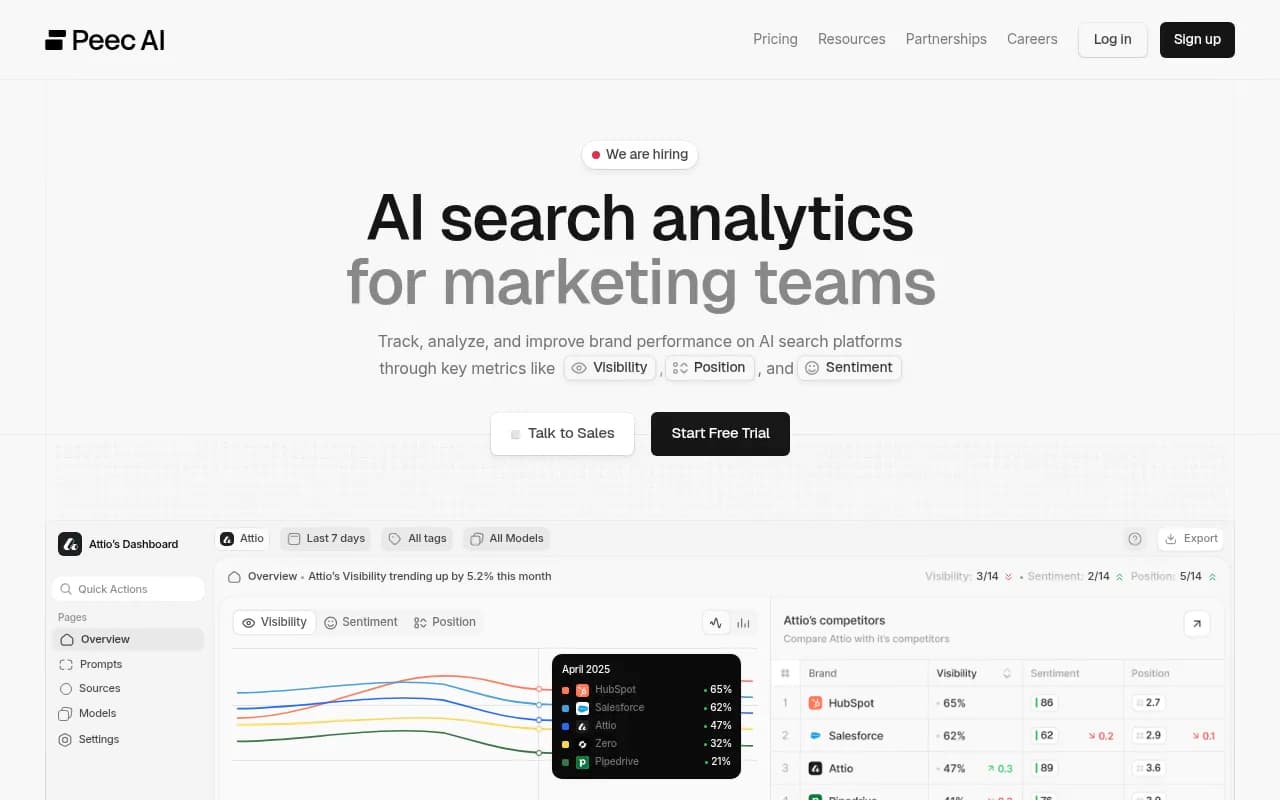

For a wider view of the field, the GEO software directory at bestgeosoftware.com lists many more options, and ai-rank-tools.com focuses on AI rank trackers.
Putting it together
Visibility score tells you if you are warm or cold. Share of voice says how much of the conversation you own. Position shows whether you are the first answer or an afterthought. Sentiment shows what the model says when it does talk about you. No single one is enough, and the diagnosis only appears when you read them side by side, per engine, over weeks.
Start with one topic that matters to revenue, find which of the four metrics is weakest, and fix the cause behind that metric before touching anything else. If you would rather hand the work to specialists, 1001 SEO Media runs GEO programs built on this exact measurement approach.