Key takeaways
- A useful AI visibility dashboard has three views: a heatmap (where you are strong or weak), a persona radar (who sees you), and an A/B period chart (what changed).
- You can build one yourself with a prompt tracker, Google Sheets, and an LLM that writes the charts. Semrush's own walkthrough puts that at about 90 minutes to build and 20 minutes a week to refresh.
- Most DIY dashboards fail on data hygiene, not charting: unstable prompt sets, branded prompts inflating the average, and engines with different citation counts.
- Platforms with built-in custom dashboards skip the plumbing. Promptwatch ships heatmaps, a persona radar, and an A/B chart as native widgets.
- Annotate your charts with known engine changes, or you will blame your content for something the model did.
What a custom AI visibility dashboard should answer
Most dashboards I see are a line chart of a "visibility score" and a table of prompts. That tells you the number moved. It doesn't tell you why, where, or for whom.
A better dashboard answers three separate questions:
- Where are we weak? (heatmap)
- Which buyer type is not seeing us? (persona radar)
- Did what we did actually change anything? (A/B period chart)
Everything else, such as top cited domains, sentiment trends, and traffic, is supporting detail. Start with these three and add widgets only when someone asks a question the three can't answer.
Step 1: Define the data model before you draw anything
The charting is the easy part. Get the data model wrong and every chart lies politely.
Decide your dimensions
Every row of data should carry these fields:
- Prompt
- Prompt group or topic (for example: problems, category discovery, comparisons, branded)
- Persona (the buyer you are simulating)
- AI engine (ChatGPT, AI Overviews, Perplexity, and so on)
- Country and language
- Date
- Brand mentioned (yes/no), position, sentiment, and cited URLs
If a field isn't in the data, you can't put it on a heatmap axis later. Adding a persona column six weeks in means those six weeks are unusable for the radar.
Fix your prompt set
Semrush's AI visibility dashboard tutorial tested 30 prompts in 5 groups of 6, tracked daily, which gives roughly 200 observations a week. Two lessons from that write-up apply to any build:
- With 6 prompts per group, one prompt flipping moves that group's rate by about 17 points. Treat small-group changes as leads, not conclusions, and grow groups to 15 or more prompts before you report on them.
- Keep the core prompt set stable for at least a month. Swapping prompts mid-stream breaks trend lines.
Also report two numbers: all prompts and non-branded only. Branded prompts nearly always show your brand, so they inflate the overall rate and hide the real gap.
Normalise for engine differences
Engines are not interchangeable. According to Promptwatch Data's sources-per-response report, ChatGPT cites about 5 sources per web-search answer, Google AI Overviews about 10, and Perplexity almost exactly 10 every day. Copilot swung from under 2 to nearly 17 within a few weeks before settling low.
So a raw "citation count" compared across engines is meaningless. Use rates (share of responses citing you) or annotate each engine's baseline. Treat Perplexity as a stable test bench, and judge Copilot on monthly trends, not weekly snapshots.
Step 2: Build the heatmap
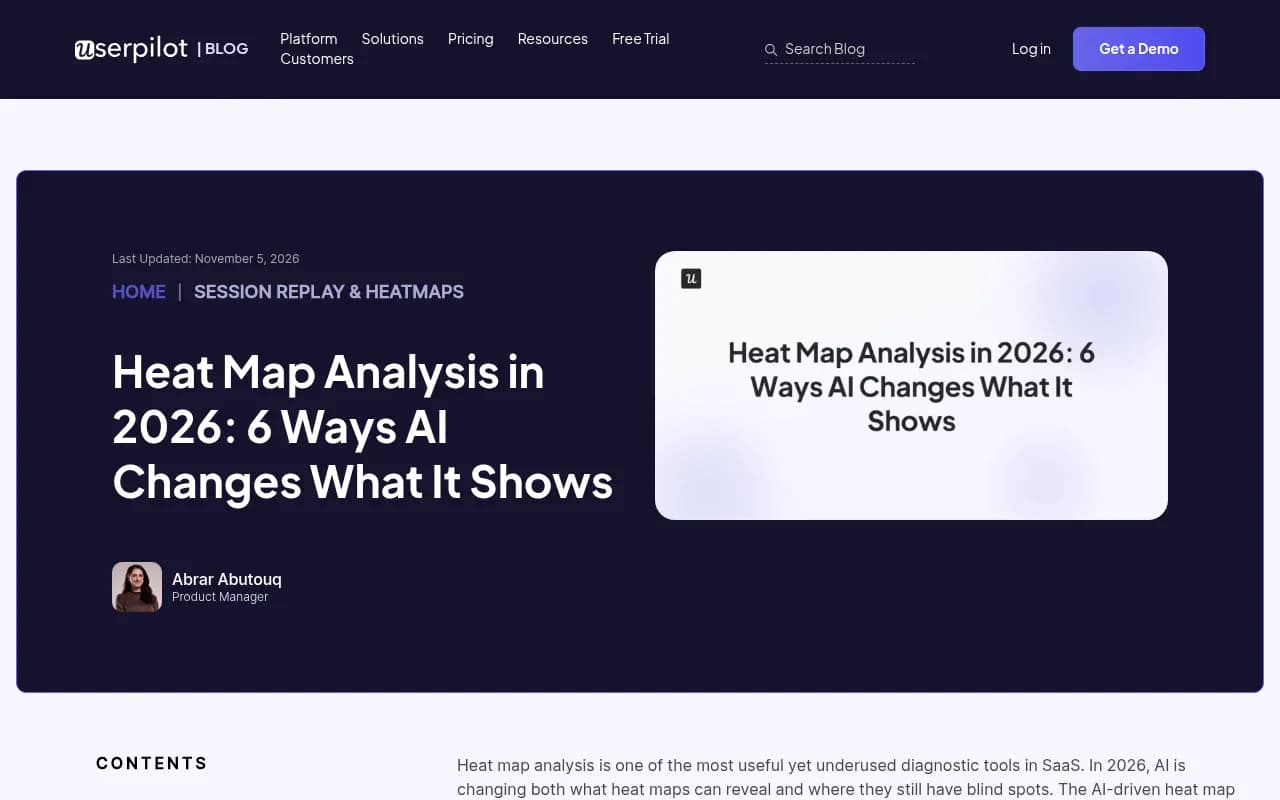
A heatmap puts two dimensions on the axes and colors each cell by a metric. Heat map analysis in product analytics works the same way: warm colors mark high activity, cool colors mark neglected areas, and you read patterns at a glance rather than scanning numbers.
Which axes are worth plotting
| Rows | Columns | Color metric | The question it answers |
|---|---|---|---|
| Topics | AI engines | Visibility | Which engine ignores which topic? |
| Brands (you and competitors) | Topics | Share of voice | Where does a rival own a topic? |
| Countries | Engines | Position | Is our rank worse in one market? |
| Personas | Topics | Sentiment | Who hears something negative, and about what? |
| Social platforms | Engines | Citation share | Where do third-party sources come from? |
The last row is a good one to build first because the data is public. In Promptwatch's social citation report for Sep 28 to Oct 4, 2026, ChatGPT drew only 0.46% of its citations from social platforms, while Google AI Overviews drew 12.2%, about 26 times as much. Put platform on the rows and engine on the columns and that gap shows up in one glance: a pale ChatGPT column next to a warm AI Overviews column, with YouTube at 4.28% and Facebook at 2.38% in AI Overviews.
DIY heatmap in Google Sheets
You don't need a BI tool for a first version.
- Keep a flat "responses" tab: one row per prompt run.
- Build a pivot table with topic as rows, engine as columns, and the average of a 0/1 "brand mentioned" column as values.
- Apply conditional formatting with a three-color scale (low, mid, high).
- Add a second pivot for the same layout with only non-branded prompts.
If you'd rather have an LLM do the build, the pattern in the ntopng write-up is worth borrowing: the model writes the query, validates it, picks the visualization, and every widget exposes the exact SQL behind it through an info icon. That last part matters. A dashboard where nobody can see the definition of "visibility" will get argued about in every meeting.
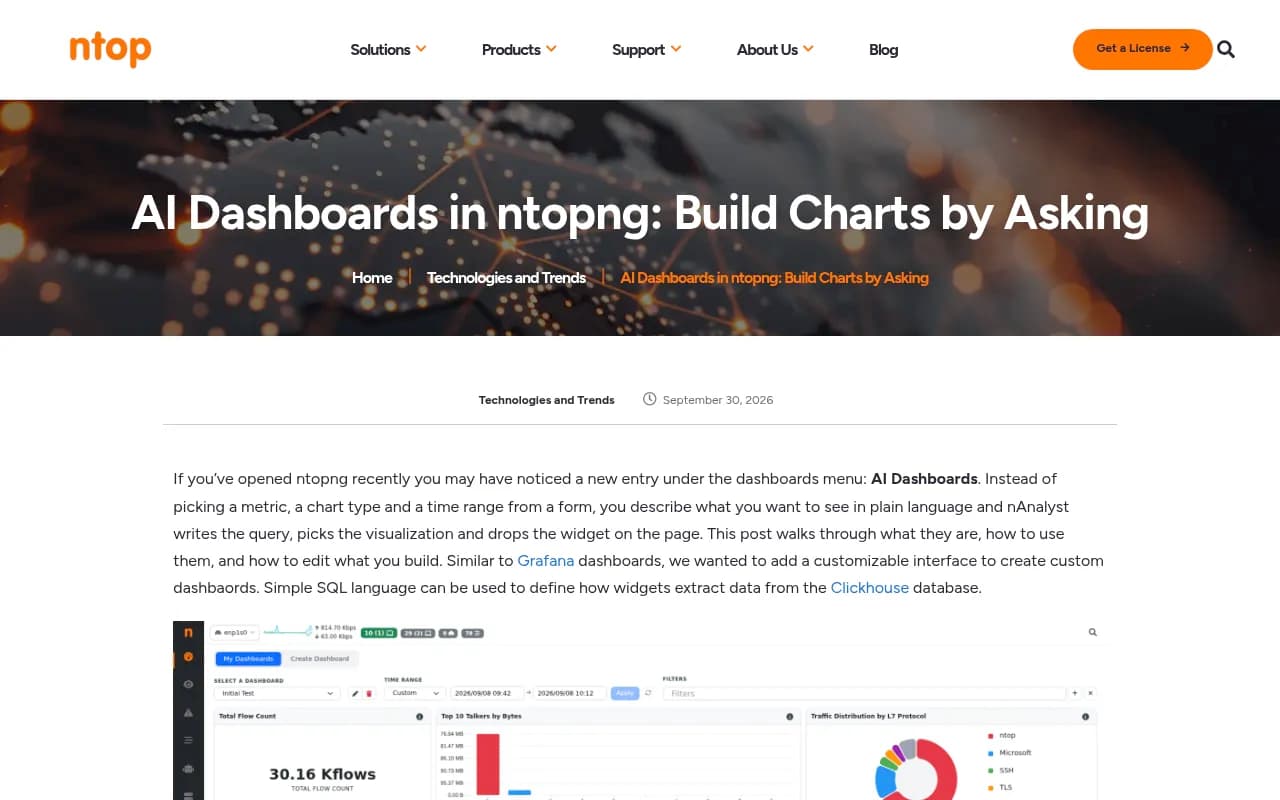
ntopng is a network monitoring product, not an AI visibility tool. I'm pointing at it only because its design (one shared time range, one filter bar, every widget reacting together) is the right design for yours.
Step 3: Add the persona radar
A radar chart works when you have 5 to 8 comparable categories and one or two series to overlay. Personas fit: each spoke is a buyer type, and you plot visibility (or position, or sentiment) for each against the general audience.
Why personas change the answer
AI answers shift with the framing of the question. A CFO asking about "cost control tools" and a developer asking about "API-first tools" can get different brand lists for the same category. A single blended visibility score averages that away, and the average is exactly what hides your problem.
How to collect persona data
- Write the persona into the prompt ("As an IT manager at a 200-person company, which..."), and keep the wording identical across runs.
- Tag every prompt with its persona so the pivot is trivial.
- Run each persona across the same engines and countries, otherwise the spokes aren't comparable.
- Use the general (no persona) prompt set as your baseline series.
Plot persona visibility as one polygon and the baseline as another. Where the persona polygon pulls inside the baseline, you have a gap. The spoke with the biggest gap is your first content brief.
Watch the sample size
The small-group warning from Step 1 applies doubly here. If a persona has 5 prompts, a radar spoke is mostly noise. Label spokes with the prompt count or grey out any below your threshold.
Step 4: Add the A/B period chart
This is the chart that proves (or disproves) your work. It compares two windows side by side: the last 28 days against the previous 28, or the month before a content push against the month after.
Set the periods deliberately
Semrush's tutorial uses the latest 28 days vs the previous 28 as its A/B pair. Equal-length windows avoid weekday skew. Whatever you pick, lock the prompt set across both periods, or you are comparing different questions.
Annotate engine-side changes
A/B comparisons break when the engine changes underneath you. Some real examples from Promptwatch Data:
- ChatGPT's share of citations to reddit.com fell from roughly 4% to 0.5% on August 14, 2026 (report). Any Reddit-driven strategy compared across that date will look like it collapsed.
- ChatGPT started using the site: operator at scale on August 8, 2026, taking it from about 0.4% to about 17% of fan-out queries overnight (report).
- Average citations per ChatGPT response dropped around the GPT-5.3 rollout on March 4, 2026 (report).
Add a vertical annotation line on your time series for each of these. If period B spans one, say so in the chart title. Otherwise the A/B result is a measurement of OpenAI's changelog.
What to put in each period bar
| Metric | Why it belongs in an A/B view |
|---|---|
| Visibility rate (all prompts) | Headline trend |
| Visibility rate (non-branded) | Strips out the branded inflation |
| Share of voice vs. top 3 competitors | Shows whether you gained or they lost |
| Self-citation rate | Whether AI cites your own pages |
| Cited pages with zero Google clicks | Content AI likes that search ignores |
That last one comes straight from the Semrush build: its first refresh surfaced a guide cited for 50 prompts that earned zero Google clicks. Joining AI data with Google Search Console page data is where dashboards stop being decoration.
Step 5: Choose your build route
There are three realistic ways to get here. The right one depends on whether your constraint is time, budget, or control.
| Route | Setup time | Heatmap | Persona radar | A/B periods | Main drawback |
|---|---|---|---|---|---|
| Sheets + LLM-generated dashboard (Semrush-style) | About 90 minutes, then 20 min/week | Pivot + color scale | Manual chart | Manual, via date filters | Manual refresh, no public sharing, private on Pro and Max Claude plans |
| BI tool (Looker Studio, Power BI, Tableau) | A day or more | Yes | Limited, often custom visual | Yes | You still need a data source and a pipeline |
| Platform with native custom dashboards | Minutes | Native widget | Native widget | Native chart | Less freedom over exotic chart types |
I didn't find reliable recipes for the persona radar in Looker Studio, Power BI, or Tableau in my research, so treat that row as "probably possible with a custom visual" rather than a promise.
Route A: Sheets plus an LLM
The Semrush approach pairs its AI Visibility Toolkit and GSC data in Google Sheets with a paid Claude plan that turns the Sheet into a live dashboard. Practical limits to know up front: connector-based artifacts need a paid Claude plan, there's no public link sharing, and Pro and Max keep the dashboard private. Team and Enterprise can share inside the organisation, but each viewer needs access to the Sheet and the Drive connector. For stakeholders outside that circle, export an HTML report.
The entry plan also covers 25 prompts, so a 30-prompt design needs a higher tier or an add-on. Check current limits before you design the prompt set around them.
Route B: Pull data from a tracker and chart it yourself
If your tracker has an API or CSV export, a BI tool will do the job. Several trackers in this space are worth a look for the data layer: Otterly.AI for lightweight tracking, Peec AI for monitoring, and Profound at the enterprise end. Most are monitoring-focused, so expect to build the persona and period views yourself.
For a wider shortlist, the GEO software directory at bestgeosoftware.com lists dozens of options.
Route C: Use a platform with dashboards built in
Promptwatch is an AI search visibility and optimization platform, and its custom dashboards cover this exact brief without a data pipeline. Team or personal dashboards let you choose and order widgets: visibility over time, sentiment, visibility by country map, a heatmap, a persona radar, top cited domains and URLs, top YouTube videos, Reddit posts, and LinkedIn posts. There are templates for competitor comparison, topic gaps, AI model breakdown, and citations, and an A/B chart to compare two time periods.
A few details that matter for the build described above:
- The heatmap puts brands, models, topics, countries, or personas on either axis, colored by visibility, sentiment, position, or share of voice. So every row of the table in Step 2 is a configuration, not a project.
- Persona insights show visibility, position, and sentiment per persona on a radar chart against the general audience, and flag the persona with the biggest gap.
- Data comes from the real interfaces of ChatGPT, AI Overviews, AI Mode, Gemini, Perplexity, Copilot and others in each country and language, which matters because user-facing answers can differ from API outputs.
- Agent Chat (or the MCP server) can build a dashboard for you from a plain-language request, and PDF reports of any dashboard can be scheduled to an inbox.
The plans are tiered: Essential is $95/mo, Professional $245/mo, Business $579/mo, with agency plans from $199/mo. Confirm current limits at promptwatch.com/pricing, and use the 7-day free trial or the free AI visibility report to see your own data before committing.
The bigger difference is what happens after the dashboard shows a gap. Promptwatch's Action Board and Content Agent can write and publish the missing pages, then crawler logs and page tracking show whether the fix got crawled and cited. Most dashboard-only tools stop at the chart. See the Visibility Score and Share of Voice definitions in the Academy if you want to align metric naming with your team first.
Step 6: Layout and governance
A dashboard that nobody trusts is a screenshot generator. A few rules from experience:
One shared filter bar
Time range, engine, country, and prompt type should apply to every widget at once. Mixed time ranges on one page cause most of the "why don't these numbers match" arguments.
Order widgets by decision, not by metric
Put the A/B period chart at the top (did it work?), the heatmap in the middle (where to look next), and the persona radar below (who to write for). Supporting widgets go underneath.
Write the definitions on the dashboard
A one-line definition per metric, visible on the page. "Visibility rate: share of tracked prompts where the brand appears. Non-branded only." This costs five minutes and saves a monthly debate.
Set a refresh rhythm
Weekly is enough for most teams. If you track hourly or every few hours around a launch, switch that on for the launch window only and go back to daily after.
Common mistakes
- Comparing engines on raw citation counts instead of rates.
- Reporting only the blended score, so persona and topic gaps disappear.
- Changing the prompt set between periods.
- Treating a one-prompt flip in a small group as a trend.
- Ignoring crawler access. If AI bots can't read a page, no amount of charting will fix it. Check with the Agentic Readiness Check or your crawler logs before you blame the content.
- Skipping annotations for known engine changes.
A starter checklist
- Pick 30 to 60 prompts across four or five groups, aim for 15 per group over time.
- Define 3 to 5 personas and tag every prompt.
- Choose engines and countries, and lock them.
- Track daily for at least four weeks before you draw conclusions.
- Build the A/B chart first, the heatmap second, the radar third.
- Annotate engine-side changes from sources like Promptwatch Data.
- Review weekly, and turn every cold heatmap cell into a content or crawlability task.
The point of all three charts is the same: to turn a cold cell, a short radar spoke, or a flat bar into a specific page that someone ships this week.