Key takeaways
- Share of voice (SOV) measures how often your brand shows up in AI answers compared with competitors. AI perception measures what those answers say about you: tone, positioning, accuracy, and which claims get repeated.
- Report both. SOV alone can reward loud, badly described brands. Perception alone can flatter a brand almost nobody sees.
- An AI SOV number means nothing without its denominator: which prompts, which engines, which region, which competitor set, which counting rule.
- Report SOV per engine with absolute counts beside the percentage. Citation slots per answer differ by engine and drift over time.
- Lead the CMO slide with SOV for the coverage question and perception for the quality question, then end with the one action each number implies.
The short answer
If you can only put one number in front of your CMO, SOV is the easier sell. It is a percentage, it has a competitor attached, and it looks like every other share metric the CMO already knows. But it answers a narrow question: are we being named?
Perception answers the question the CMO usually cares about more: when we are named, are we described the way we want to be described? A brand can sit at 35% SOV and be summarized as "cheap but limited." Another can sit at 12% and be called "the safe choice for enterprise teams." Which one would you rather own?
So the honest answer is both, with a clear division of labor. SOV is the coverage metric. Perception is the quality metric. This guide covers how to define each, how they go wrong, and how to lay them out for an executive audience.
What share of voice means in AI search
Share of voice started life as advertising spend: your media spend as a percentage of total category spend. Teams later stretched the same ratio to social mentions, earned coverage, organic traffic estimates, and now AI answers. The growthx study guide on share of voice makes the point that matters here: the original meaning was spend, so an unlabelled SOV number has no fixed meaning.
In AI search, the HubSpot glossary definition is a fair baseline: the percentage of brand mentions in AI-generated answers that belong to your company versus others in your category. Its example is simple. If you appear in 30 out of 100 relevant responses and a competitor appears in 50, you have 30% against their 50%.
The formula is the usual one:
AI SOV = (your brand mentions / total mentions for the competitor set) x 100
The trouble is everything hiding inside that fraction.
The denominator problem
Vendors do not agree on what goes under the line. One tool divides by total brand mentions across the set. Another divides by the number of responses. A third weights mentions by prompt volume. Two tools can report different SOV for the same market on the same day, and both are "right."
Change the competitor set and your percentage moves even if you did nothing. Add a strong new rival to the tracked list and your SOV drops. Remove one and it climbs. A CMO who sees a 4-point swing will ask what you did. Sometimes the answer is "we edited the spreadsheet."
The fix is boring and effective: write the denominator next to the number. For example, "tracked mentions for five named competitors, 120 prompts, four engines, United States, 30 days."
Slot counts differ by engine
There is a second structural issue. Engines do not cite the same number of sources per answer. Promptwatch's Average Sources Per Response report shows ChatGPT citing about 5 sources per web-search answer, Google AI Overviews about 10, and Perplexity almost exactly 10 every day. Copilot's average swung from under 2 to nearly 17 within a few weeks before settling at the low end.
The implication is practical. SOV percentages are not comparable across engines, and an SOV shift can come purely from an engine changing how many sources it shows. If your ChatGPT SOV dropped the week a model update rolled out, check the slot count before you blame your content. Promptwatch Data also tracked a citation drop around the GPT-5.3 rollout in March 2026, which is exactly the sort of event that moves SOV without any change on your side.
Report SOV per engine, with absolute counts beside the percentage. Perplexity's stable slot count makes it a cleaner engine for testing whether a content change moved anything.
Mentions versus citations
A mention is your brand named in the answer text. A citation is your site linked as a source. They are different measurements and they fail differently. Mentions without citations usually point to a crawlability or content problem on your own domain. Citations without mentions suggest AI uses your pages but does not name you. Pick one as the SOV basis, say which, and show the other as a companion figure. Promptwatch's citations vs mentions guide walks through the distinction.
What AI perception means
AI perception is my shorthand for how AI describes and positions your brand. It is not a standard industry term, so define it for your CMO before you use it. A practical definition has four parts:
- Sentiment. Is the tone of responses positive, neutral, or negative?
- Prominence. Are you the first recommendation or the fifth brand in a list?
- Positioning claims. What specific things does AI say about you? "Affordable for small teams." "Weak mobile app." "Best for enterprise."
- Accuracy. Are those claims true, and which of your pages are teaching AI the wrong thing?
A thread on r/AskMarketing put it well: AI does not just mention brands, it describes them and positions them. That is the gap SOV cannot see.
The PR world has its own version of this argument. Spin Sucks recently framed it as narrative share of voice: not how loud you are, but whose words the category uses. When competitors, analysts, and prospects start repeating your framing of the problem, you own the narrative. You can buy volume. You have to earn narrative. That is a PR-flavored definition, but the underlying idea is the same one perception metrics try to capture in AI answers.
Why equal SOV can mean opposite things
The growthx guide makes the cleanest version of this point: equal SOV can carry opposite meanings when one brand's coverage is positive and prominent and another's is negative or buried. Mention counts reward volume, including negative volume. A product recall inflates your social SOV. A string of "alternatives to [your brand]" comparisons inflates your AI SOV while telling buyers to look elsewhere.
This is why you should never set a volume target without a sentiment and prominence check.
SOV vs perception at a glance
| Dimension | AI share of voice | AI perception |
|---|---|---|
| Question answered | How often are we named or cited versus competitors? | What does AI say about us when it names us? |
| Typical unit | Percentage of mentions or citations | Sentiment score, position, claim themes, accuracy |
| Failure mode | Rewards loud or negatively described brands | Can flatter a brand almost nobody sees |
| Sensitive to | Competitor set, denominator, engine slot counts | Prompt wording, personas, model updates |
| Diagnoses | Coverage problem | Reputation, positioning, or content-accuracy problem |
| CMO decision it informs | Where to invest for reach and coverage | What to fix in messaging, content, and sources |
| Easiest to explain as | Share of market for AI answers | Brand tracking for AI answers |
Which one to lead with
It depends on what your CMO is trying to decide this quarter.
Lead with SOV when you are entering a category, fighting for the shortlist against named competitors, or justifying budget for content and digital PR. Coverage is the bottleneck, and the competitor comparison is the story.
Lead with perception when you already show up but conversion from AI traffic is weak, when a competitor is being recommended over you in comparison prompts, or when AI is repeating something wrong about pricing, features, or support. The bottleneck is how you are described.
Lead with both when the CMO reports to a board. Boards like a share number, and they also ask "what are they saying about us?" within about ninety seconds.
If you want a one-line rule: SOV tells you whether to push harder on reach, perception tells you whether the reach you have is helping.
The reporting pack I would build
A single SOV and a single sentiment score is too thin. Here is a compact pack that fits on a slide or two.
1. Headline SOV, per engine
One row per engine, with your SOV, the top two competitors' SOV, and the absolute mention count behind it. Put the denominator in a footnote. Do not average engines into one number unless you state a weighting rule. Average across engines with different slot counts and you are blending apples with a fruit salad.
2. Citation share alongside it
A LinkedIn piece on measuring AI SOV with Semrush makes a useful point: pair SOV with citation frequency and citation share, because frequency alone does not show your competitive position. Self-citation rate, the share of citations pointing at your own domain, tells the CMO whether AI is learning about you from you or from someone else.
3. Perception scorecard
Three or four lines:
- Sentiment score versus the top competitor
- Average position when named (first, second, buried)
- The top three positive and top three negative claims AI makes about you
- The number of inaccurate claims you have identified, and which pages are likely feeding them
4. One trend and one cause
A CMO will forgive a bad number faster than an unexplained one. For each movement, give the likely cause: a model update, a competitor launch, a new piece of content getting cited, a crawler access fix. Restart the baseline and mark the break if you change the prompt set or competitor set.
5. The action each number implies
This is the part most dashboards skip. Read the metrics together:
| Pattern you see | What it usually means | Typical next move |
|---|---|---|
| Low SOV, positive sentiment | Coverage problem | Publish content for uncovered prompts, build third-party mentions |
| High SOV, weak sentiment | Reputation or positioning problem | Fix messaging, address the sources driving negative claims |
| Mentions but few self-citations | Content or crawlability problem | Check AI crawler access, strengthen citable pages |
| High SOV, late position | Prominence problem | Improve comparison and category pages, earn stronger third-party reviews |
| Good numbers, inaccurate claims | Accuracy problem | Correct the pages AI is learning from |
Tools for tracking both metrics
Most AI visibility tools report some form of SOV. Fewer treat perception as a first-class metric, and fewer still tell you which page is causing a wrong claim.
Promptwatch tracks Visibility Score, Share of Voice, position, and sentiment together, and its Brand Narrative feature pulls the individual claims AI makes about you and your competitors out of tracked responses, groups them under themes like Pricing, Features, and Support, and scores each theme from 0 to 100. Fact Check lets you mark a claim accurate or inaccurate, then points to the pages on your site that state it. Prompts are collected from the real interfaces of ChatGPT, Gemini, Perplexity, Google AI Overviews and others, per country and language, which keeps the denominator honest. It also closes the loop with crawler logs, page tracking, and a Content Agent for the fixes. Pricing starts at $95/mo with a 7-day free trial; confirm current plans at promptwatch.com/pricing.
Other tools worth a look, depending on how much weight you put on each side:
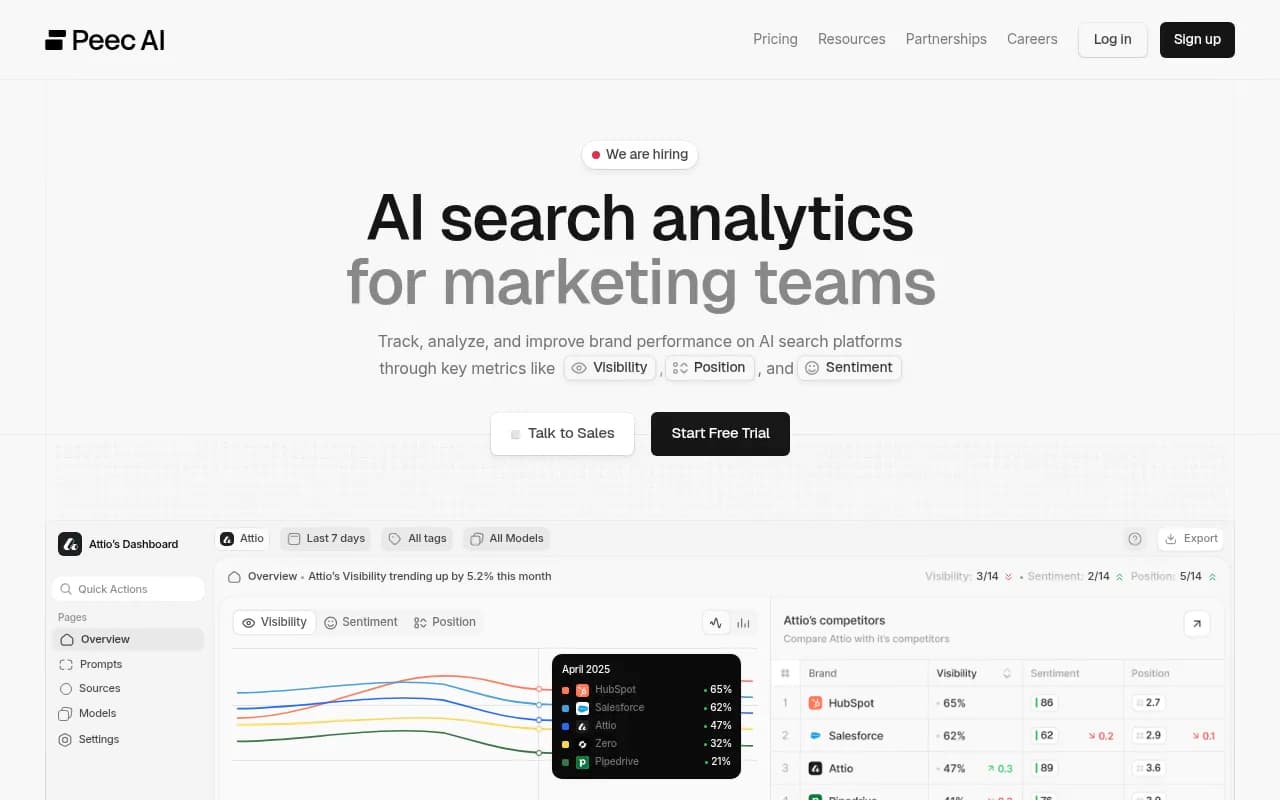
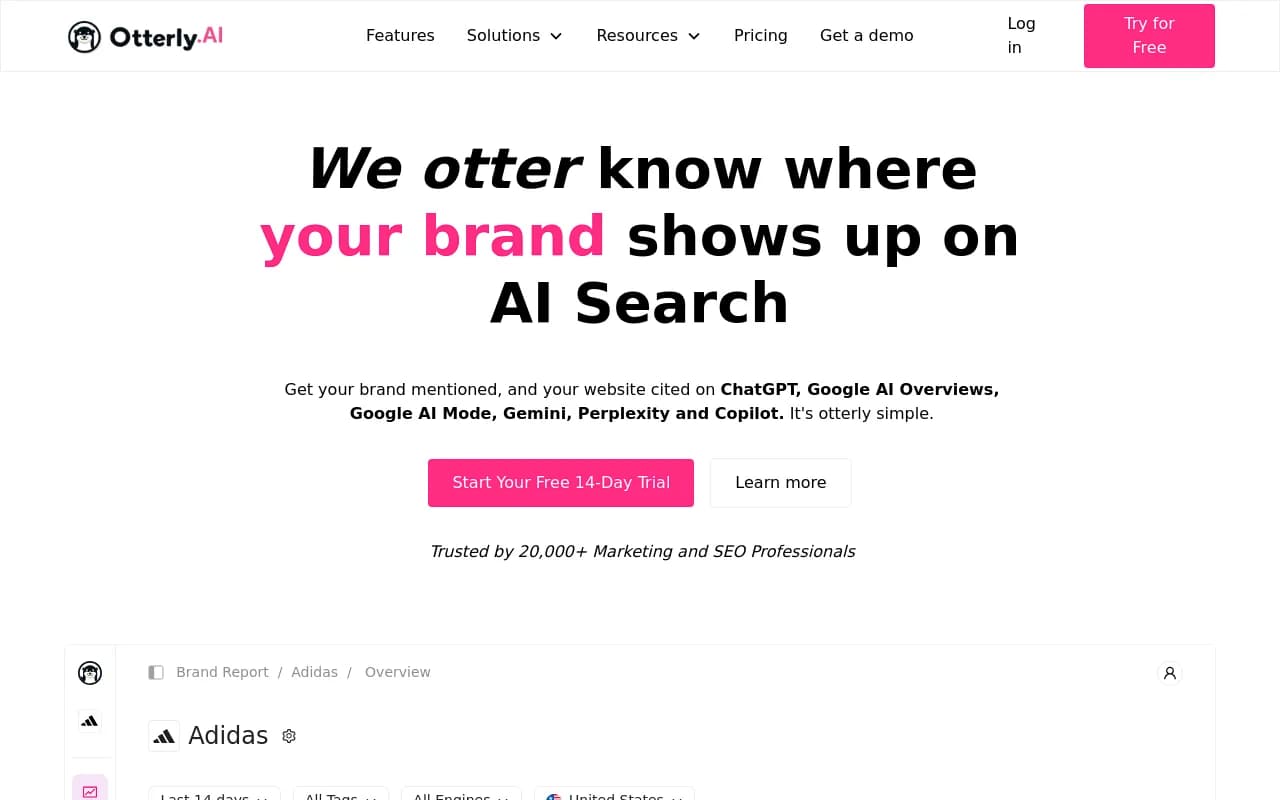
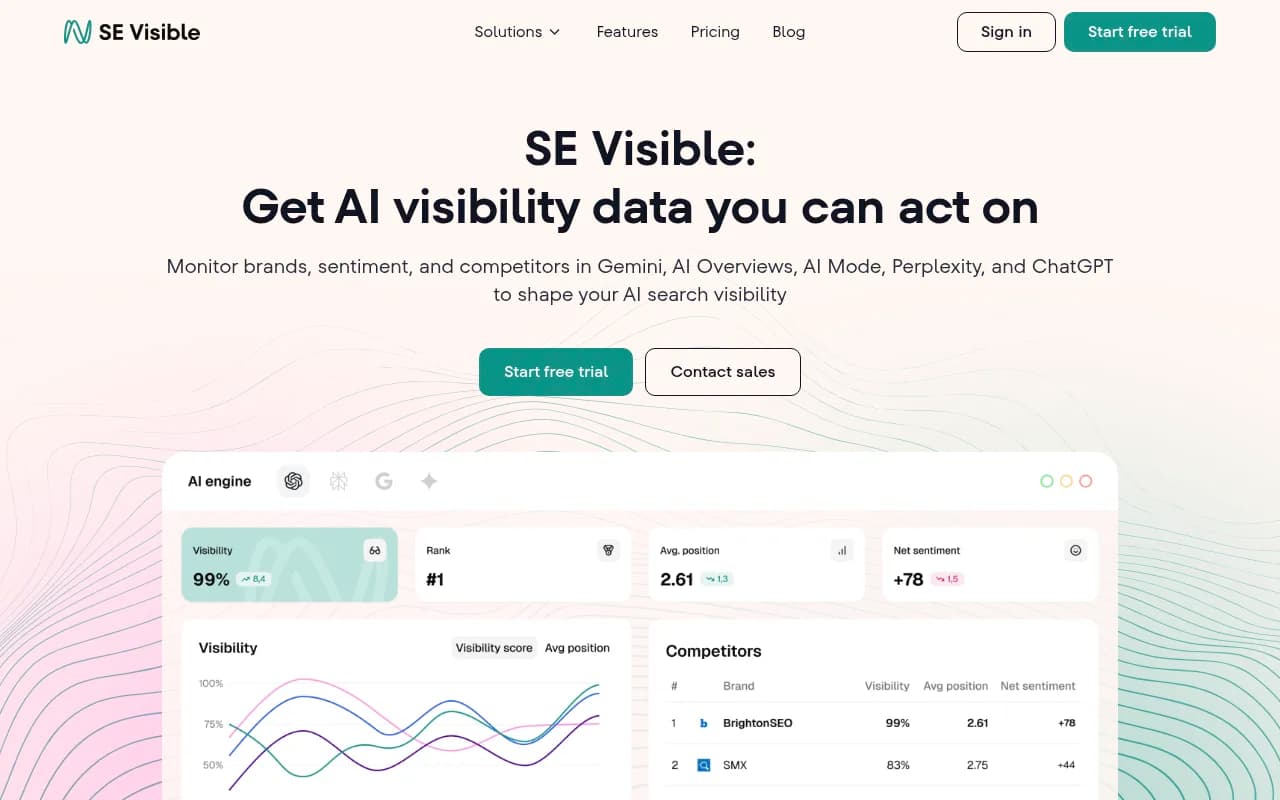
SE Visible tracks visibility and sentiment together, Semrush bolts AI tracking onto a traditional SEO suite, and Profound sits at the enterprise end. Peec AI and Otterly.AI are lighter monitoring tools and generally stop at reporting. For a broader comparison, the directory at bestgeosoftware.com lists GEO platforms side by side.
| Tool | Tracks SOV | Perception or sentiment | Acts on the findings |
|---|---|---|---|
| Promptwatch | Yes, per model and monitor | Sentiment, Brand Narrative, Fact Check | Content Agent, Action Board, crawler logs |
| Profound | Yes | Yes | Mostly monitoring |
| Peec AI | Yes | Basic | Monitoring only |
| Otterly.AI | Yes | Basic | Monitoring only |
| SE Visible | Yes | Visibility and sentiment | Limited |
| Semrush | Yes, fixed prompt sets | Limited | Part of a wider SEO suite |
Treat that table as a starting point, not a verdict. Features change quickly, so check each vendor before you buy.
Common mistakes when reporting to a CMO
Reporting a single blended number
One "AI visibility score" is tempting. It hides engine differences, mixes coverage with quality, and cannot be diagnosed. Show the components.
Hiding the sample
Answers vary between runs of the same prompt. One reading from one engine on one day is a sample, not a ranking. Fix the prompts, engines, region, run count, and counting rule before you track change, and report a range when repeated runs vary.
Celebrating SOV growth that came from a shrinking set
Your percentage rises when you grow, when competitors shrink, or when the set gets smaller. Show the absolute count next to the percentage. A rising SOV can sit on top of falling category volume.
Ignoring the buyer
A generic prompt set measures a generic buyer. If your real buyers are CFOs and IT leads, prompt as those personas. Perception often looks different by persona, and the biggest gap is usually the interesting finding.
Treating perception as vibes
Perception can sound soft, so make it concrete. Quote the three claims AI repeats most, the models that repeat them, and the pages they trace back to. A CMO can act on "AI says our support is slow, here is the source." A CMO cannot act on "sentiment is 58."
A sample CMO slide
Here is a layout that has worked for me in similar reporting situations.
- Title line: AI visibility, [quarter], [market], [engine set]. Denominator in small print.
- Left panel, coverage: SOV per engine against the top two competitors, with absolute mentions and self-citation rate.
- Right panel, perception: sentiment versus the top competitor, average position, top positive and negative claims.
- Bottom strip: one cause for the biggest movement, and the one action planned for next quarter.
If you need a place to start with prompts and definitions, Promptwatch's Share of Voice and metrics overview pages are plain-language references you can hand to a CMO who wants to check your math.
Quick answers
Is AI SOV the same as share of model? Not exactly. Share of model usually refers to how often a model picks your brand across a set of prompts. SOV is a share of mentions across a competitor set. The inputs differ, so label which one you use.
Can I tie SOV to revenue? Loosely. The strongest evidence linking SOV to growth is for ad spend, via excess share of voice against market share. It does not transfer automatically to AI mentions. Pair SOV with AI-referred traffic and conversions from your own analytics before you claim impact.
How often should I report? Monthly for the CMO, weekly for the team. AI answers are noisy, so trend lines beat single readings.
What to do this week
Pick your denominator and write it down. Split your SOV by engine. Pull the top three claims AI makes about you and check them against your own site. Then build the two-panel slide above. If someone asks which metric matters more, tell them SOV shows whether you are in the room and perception shows whether anyone believes what is said about you there.