Key takeaways
- Visibility Score is presence. Position is prominence. Share of Voice is competitive weight. They answer three different questions, so read them together.
- A 40% score in one tool is not necessarily a 40% score in another. Check the formula and the prompt set before comparing dashboards.
- A single prompt run tells you little. Answers drift, and one tracker's own docs say to treat the number as a trend, not a verdict.
- Mentions without citations usually point to a content or crawlability problem, not a branding one.
- Platform changes can move your numbers overnight, so check for a model rollout before blaming your content.
Why ChatGPT rank data does not look like Google rank data
A Google rank tracker gives you a number from 1 to 100. A ChatGPT rank tracker cannot, because there is no list of ten blue links. The model writes an answer, names a handful of brands, and maybe links a few sources. You are either in it or you are not.
That changes what "rank" means. Tracking tools run a fixed set of prompts on a schedule, store every answer, and derive metrics from the pile. Every number you see is a calculation over those stored answers, which is why two tools can show different figures for the same brand.
Google rank also predicts very little here. Leapd's review of tools cites a 12% overlap between ChatGPT-cited URLs and Google's top 10, and Profound puts the overlap of ChatGPT's sources with Google's at 39%. The methods differ, so the numbers differ, but both say the same thing: page one on Google does not guarantee a mention in ChatGPT. You need a separate measurement layer.
The three core metrics
Visibility Score
Visibility Score is the simplest metric and the easiest to misread. Peec AI's version is the cleanest definition: responses mentioning your brand divided by total responses, times 100. If you show up in half the responses, your score is 50%.
TrueRanker calls the same idea a mention rate: the share of tracked prompts where ChatGPT named your brand, on a 0 to 100 scale. Profound defines it as mentions out of total responses tracked.
Some platforms use a more elaborate version. In Promptwatch, for instance, each response is scored on placement, share of attention and depth, then averaged, and responses that do not mention the brand count as zero. So a high score there means you appear early and substantively, not just that you appear.
What it tells you: coverage. Do you exist in the conversation for the prompts you picked?
What it does not tell you: how well you are treated once you are there, or whether anyone clicks.
Position
Position (Profound calls it Average Position) is where your brand lands in the order of brands within an answer. Lower is better. An average of 5.1, as in Profound's own walkthrough, means you appear but typically after four other brands.
Two things to check before you trust a position number:
- Position only exists in answers where you were mentioned. If your visibility is 8%, your average position is built on very few answers and will bounce around.
- Tools differ on what they order. Most count order of brand mention in the answer text. Some may look at order in the citation list. I could not find a standard definition, so read the vendor docs.
Position matters because answers are read top-down. The first named brand gets the attention, and Frase makes the same argument: appearing first dramatically improves click-through potential.
Share of Voice
Share of Voice is your slice of all brand mentions across the tracked prompts. TrueRanker's example is a good illustration: a brand at 55% share of voice, with competitors at 28%, 12% and 5%. It always sums against the rivals you chose to track, which is the catch. Add or remove a competitor and your share moves without anything changing in ChatGPT.
It is a competitive metric. Dataslayer's advice is blunt: skip vanity numbers like a visibility score without context, and focus on share of voice against your top three competitors.
The formula also is not settled. Digital Applied shows one brand scoring 20% with a mention-based formula, 16.8% position-weighted, and 31.4% citation-based, all on the same data. None is wrong. They answer different questions, so pick the one that matches your goal and keep it fixed.
What the three look like together
The useful trick is reading the metrics as a set. Each combination points at a different kind of problem.
| Pattern | What it usually means | Where to look |
|---|---|---|
| Low Visibility, low Share of Voice | Coverage problem. AI does not associate you with these prompts. | Content gaps, topics you have no pages for |
| Good Visibility, late Position | Prominence problem. You are mentioned but after competitors. | Comparison content, third-party reviews |
| Good Visibility, few citations | Content or crawl problem. The model knows you but does not link you. | Crawler access, page structure, source pages |
| Visibility steady, Share of Voice falling | A competitor is gaining, not you losing. | Competitor mentions per prompt |
| Good numbers, weak sentiment | Reputation problem. | The actual answer text |
Mentions versus citations
A mention is ChatGPT naming you. A citation is ChatGPT linking your site as a source. TrueRanker deliberately counts them separately: when mentions climb and citations do not, the model knows who you are but does not think your site is worth linking. That gap is technical and fixable, which is why it is worth tracking as its own line.
Why the numbers move when your content did not
Before you celebrate or panic, rule out noise.
Answers drift
Digital Applied reports that cited domain sets drift 40 to 60% month over month in active categories. A single snapshot lies. Their recommended minimum is a panel of 100 to 200 prompts run weekly. TrueRanker runs weekly on the reasoning that answers shift over days, not hours, and a weekly series gives you a trend instead of noise.
Platform changes
Promptwatch Data has recorded several overnight shifts that had nothing to do with individual brands:
- Average citations per ChatGPT response dropped across GPT-5.3, GPT-5.4 and GPT-5-Mini around the GPT-5.3 rollout on March 4, 2026 (ChatGPT citation drop).
- ChatGPT started using the site: operator at scale on August 8, 2026, jumping from about 0.4% to about 17% of fanout queries (site: operator report).
- reddit.com's share of ChatGPT citations fell from roughly 4% to 0.5% on August 14, 2026 (Reddit citations report).
If your numbers jumped on one of those dates, suspect the platform first.
Query fan-outs
ChatGPT does not search for your prompt verbatim. It generates its own queries, and your content only has to match one of them. Promptwatch's query fanout report shows the average fell from about 2.15 searches per response in December 2025 to about 1.84 by early March 2026. The page also says a single prompt can trigger 3 to 8 or more searches, which I would treat as a ceiling, not typical behavior. Either way, results for a tracked prompt vary with how that prompt gets fanned out.
Crowded answers
Answers are crowded. In Promptwatch's unique domains report (Sep 28 to Oct 4, 2026), 47.6% of ChatGPT responses that carried citations cited 10 or more domains, and 66.1% cited at least 8. Its separate average sources report puts the average nearer 5 sources per web-search answer. The two use different periods and counting methods, so do not mix them, but both say you will share the answer with others. Aiming for a position of 1 in every response is unrealistic. Track where you appear and how ChatGPT describes you, not just whether you are cited.
How different trackers define the same words
Profound's walkthrough is worth reading for how it frames the trio: Visibility Score as a percentage of mentions out of responses tracked, Share of Voice against competitors with a rank, and Average Position as a gauge of whether you typically appear before rivals. In its example, a brand had 0.1% visibility ranked 339th, and across the top 10 brands share of voice varied by only about 2%. That second detail is a good reminder that tight categories produce small differences.
| Tool | Visibility definition | Cadence | Notable detail |
|---|---|---|---|
| Profound | Mentions out of total tracked responses | Not stated in research | Visibility Rank and Share of Voice Rank |
| TrueRanker | Mention rate, 0 to 100 | Weekly | Separate mention and citation counts, full answer text stored |
| Peec AI | Responses mentioning brand / total responses x 100 | Not stated in research | Position, sentiment and SoV kept separate from visibility |
| Promptwatch | Weighted score of placement, share of attention and depth | Daily on every plan, up to hourly on higher plans | Also includes Share of Voice, Position, sentiment and citation rank |
Beamtrace's point holds across all of them: a 40% result in one platform may not mean the same thing as 40% in another. Compare how the score is built first.
A practical routine for reading your data
Step 1: Fix the prompt set
Choose prompts that match what buyers actually type, including organic, branded and competitor comparison types. Keep them stable. Changing prompts mid-quarter ruins your trend line. Promptwatch's data also shows that brand-specific prompts behave differently: 5 domains is the most common citation count there, versus 10 or more for organic prompts. Segment them rather than averaging.
Step 2: Establish a baseline
Run for at least a few weeks before drawing conclusions. Note Visibility, Position, Share of Voice and citation rate per topic, not just overall. A blended number hides which topics are weak.
Step 3: Read the answers
Numbers say that you lost a recommendation. The text says why. TrueRanker stores the full answer for each scan, and Profound and others let you drill into responses. Spend time on the prompts where a competitor is named and you are not. That list is your content plan.
Step 4: Check for external causes
Before acting on a swing, check model rollouts and platform behavior changes. Cross-check against other prompts in the panel. If everything moved on the same day, it was probably not you.
Step 5: Tie it to traffic
Visibility is only worth something if it drives visits. Dataslayer cites LLM visitors converting 4.4 times better than traditional organic visitors, though in smaller volumes. Match your rank data against AI referral analytics so you know which visibility gains actually bring people in. Keep in mind that referrer data can be unreliable, so tagged links help.
Tools worth a look
If you want one platform that covers the monitoring and the fixing, Promptwatch tracks Visibility Score, Share of Voice, Position and sentiment across ChatGPT, Gemini, Perplexity, Google AI Overviews and others, using real interface data. It then connects to the content and crawler side, so a low score becomes a to-do list. The metrics overview in its Academy explains how the numbers fit together.
Profound is the enterprise option with a polished Visibility, Share of Voice and Position dashboard and competitor rankings.
TrueRanker suits teams that want Google rankings and ChatGPT mention and citation tracking in one project, with weekly runs and a low entry price.
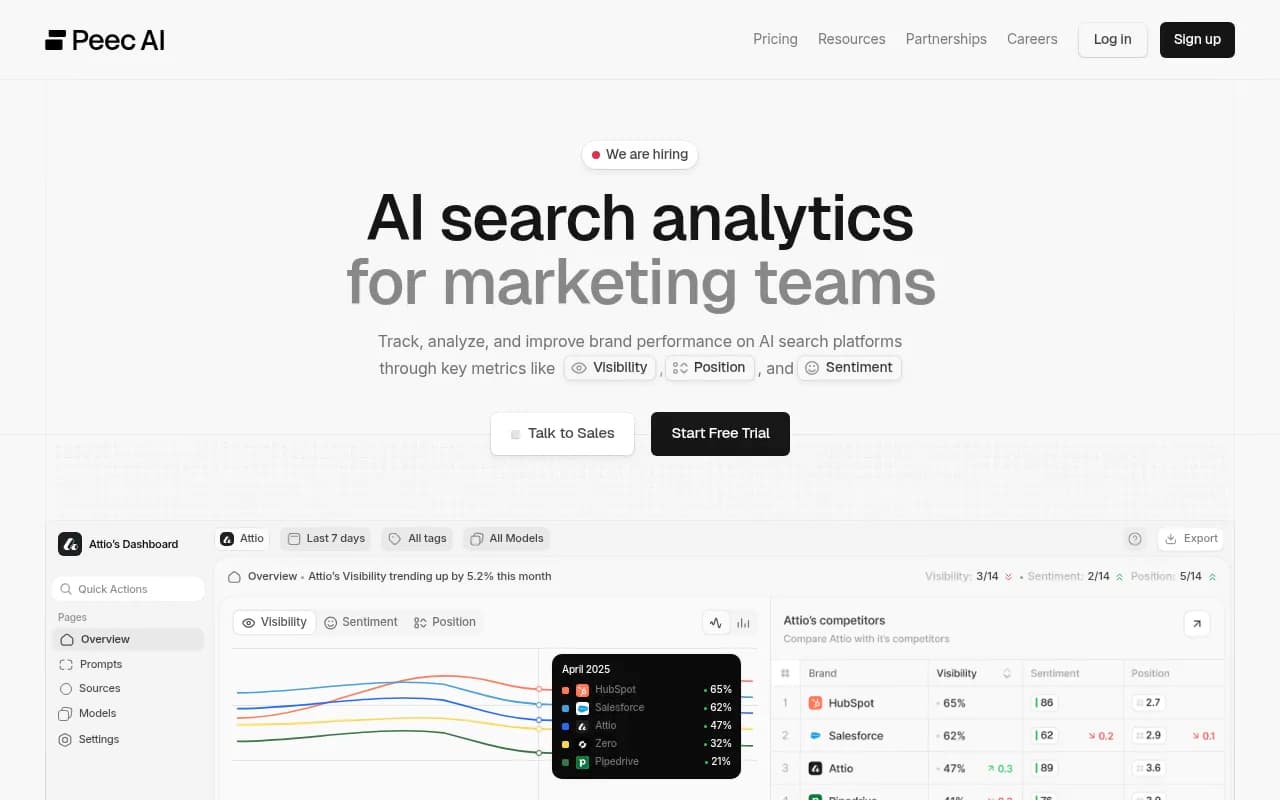
Peec AI is a straightforward monitor with clean metric definitions.
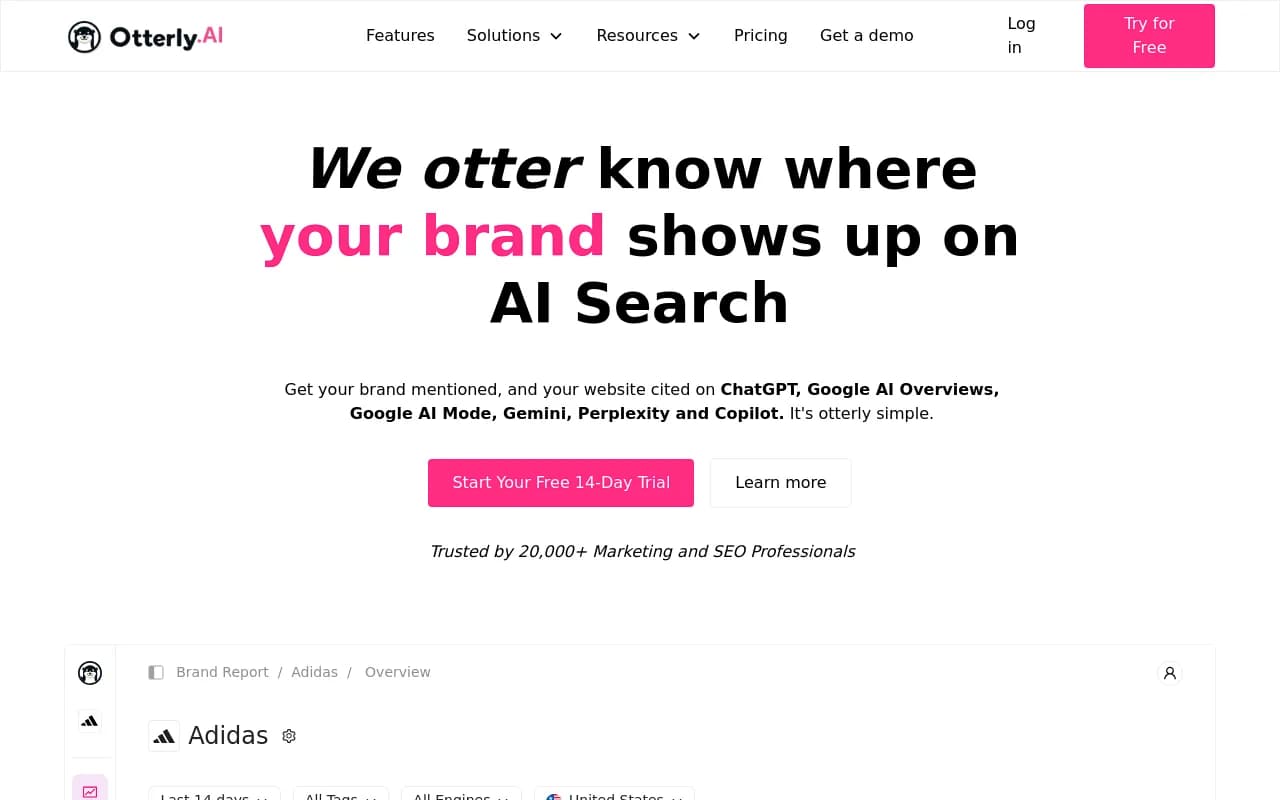
Otterly.AI is another affordable option for basic tracking.
For a wider list, the GEO software directory at bestgeosoftware.com and the rank tracker directory at ai-rank-tools.com are good places to compare options.
Common mistakes
- Comparing scores across tools without checking formulas.
- Reading Position when visibility is tiny. The sample is too small.
- Treating a Share of Voice change as your own win when a competitor was just removed from the panel.
- Judging from one day. Use weeks.
- Ignoring citations because mentions look healthy.
- Tracking only ChatGPT. Digital Applied cites an 11% domain overlap between ChatGPT and Perplexity, so each engine is its own game.
What to do next
Pick one formula for each metric, write it down, and keep your prompt panel fixed for a quarter. Then read your first month as a baseline, not a verdict. The biggest wins usually come from the list of prompts where a rival is named and you are not, so start there and check again in a week.
For a quick starting point, Promptwatch offers a free AI visibility report that scans how ChatGPT, Gemini and Perplexity talk about your brand.