Key takeaways
- AI answer engines evaluate each location almost independently, so a single national snapshot hides which branches are actually invisible. SOCi's 2026 Local Visibility Index found brand locations appear in AI recommendations only 6.5% of the time on average, far below their traditional local search presence.
- Rank position is close to meaningless for AI answers. SparkToro's repeated-prompt testing found you'd need roughly 1,000 runs before seeing the same brand ordering twice, so appearance rate across many runs beats "are we #1."
- The fix isn't 20 tabs open in 20 browser windows. It's a three-layer structure, portfolio view, market view, run view, that drills from "how's the whole brand doing" down to "what did ChatGPT actually say about our Tucson branch on Tuesday."
- Mention rate and citation rate diverge by engine (ChatGPT mentions more, cites less; Perplexity does the opposite), so track both, not just one.
- Pricing for multi-location AI visibility tools in 2026 ranges from credit-based models like Local Falcon ($24.99-$199.99/mo) to per-location platforms like Synup ($499/mo for 25 locations) or BrightLocal (priced per location band). A 25-location service brand typically pays $156 to $499/month at list price depending on vendor.
Why 20 locations means 20 different AI search realities
Here's the thing nobody tells you when you start this project: there is no such thing as "your brand's AI visibility." There's your visibility in Phoenix, which is nothing like your visibility in Boston, which is nothing like your visibility in Toronto. These aren't the same market wearing different hats. They're effectively separate retrieval environments.
Cheers ran a 28-day test across 100 metro service areas using the same 32 home-services buyer prompts on four AI engines and classified 356,019 citations. Directory and review-platform citation share swung from 34.6% in Oakland to just 12.3% in Toronto. The number of distinct domains cited per metro ranged from 373 in Medicine Hat to 852 in Toronto. If you're a 20-location HVAC company and you only watch a brand-level dashboard, you have no idea that your Toronto market is drowning in 2.3x more competing sources than your Medicine Hat market, and that's exactly the kind of thing that explains why one branch underperforms while another coasts.
It gets worse before it gets better. OpenAI's own web search API supports passing an approximate location (country, free-text city, timezone) to localize results, but that localization isn't even supported for deep research models using web search. One vendor, inconsistent location handling within its own product line. Multiply that inconsistency across ChatGPT, Gemini, Perplexity, and Google AI Overviews, and you understand why a single "are we visible" dashboard built for one location breaks the moment you try to bolt on location #2 through #20.
The trap: 20 tabs, 20 logins, zero pattern recognition
The instinct, especially for agencies managing multi-location clients, is to spin up a separate project or workspace per location inside whatever tool you already use. It feels thorough. It's actually the opposite of thorough, because:
- You lose the ability to compare markets side by side without exporting to a spreadsheet
- Nobody notices a brand-wide problem (a weak schema setup, inconsistent NAP data, thin location pages) until it's already tanked visibility in five markets
- Client reporting becomes a Friday-afternoon copy-paste exercise instead of something you can hand over in two clicks
- Per-seat or per-project pricing on most tools quietly turns a 20-location rollout into a four-figure monthly bill
SOCi's research on multi-location brands backs up why this matters structurally, not just operationally. AI models evaluate a brand's entire digital footprint when deciding whether to recommend it. If even a handful of your 20 locations have inconsistent listings, dead review profiles, or weak content, the AI treats the whole brand as a risk signal and under-recommends it everywhere, not just at the broken location. Tracking locations in isolation means you'll never catch that the Dallas branch's bad Yelp data is quietly dragging down recommendation rates in Austin.
The structure that actually scales: portfolio, market, run
Cheers' audit playbook for multi-location AI visibility lands on a three-layer model that's worth stealing regardless of which tool you use:
Portfolio view. Visibility score, citation rate, and competitor share of voice across the entire brand footprint, all 20 locations rolled up. This is the slide you open the board meeting with.
Market view. Drill into one service area. Which prompts, which competitors, which sources are getting cited for "emergency plumber in Phoenix" specifically. This is where you explain to the regional manager why Phoenix underperforms Tucson.
Run view. The actual answer, with its citation trail, for one prompt, one engine, one location, one date. This is your receipt. When a client asks "prove it," this is what you show them.
The record you keep per test should include the buyer question, target city, engine, date, which providers got recommended, which source URLs got cited, whether your correct branch showed up, whether the AI used the right service language, and who owns the fix. Skip any of those fields and you'll eventually hit a wall where you know something changed but can't explain why.
Build your prompt set from buyer language, not internal labels
A mistake that wrecks multi-location tracking before it starts: building prompts around your internal service-line names instead of how customers actually ask. Cheers' recommendation for home services is to cover emergency, replacement, maintenance, financing, warranty, after-hours, and near-me phrasing, per vertical, per market. A roofing company's prompt set should include "emergency roof leak repair near me" and "roof replacement cost [city]" long before it includes whatever the sales deck calls your tiers.
This matters more for local queries than most people assume. Promptwatch's citation data shows organic, non-branded prompts, the category local "near me" queries fall into, are the most crowded: 52.5% of ChatGPT responses to these cite 10 or more domains, and 71.8% cite at least 8. Compare that to brand-specific prompts, where only 21.3% cite 10+ domains and five sources is the single most common citation count. Translation: when someone searches generically for a service in their city, you're competing against far more sources than when someone already knows your name and asks about your specific branch. Local SEO work on branch-level pages pays off disproportionately for exactly this reason, you're fighting for a spot in a request where fewer slots exist once someone names you directly.
Why one-off screenshots lie to you
Rand Fishkin's SparkToro research asked the same brand-recommendation question 100 times and found almost entirely unique orderings, you'd need roughly 1,000 runs before seeing two identical lists. Rank position in an AI answer isn't stable enough to be a metric. It's noise dressed up as signal.
Cheers found the same thing operationally, tracking a 13-company home-services panel, pooled non-branded appearance rate moved from 29.8% to 32.2% to 26.9% and back to 29.8% within six weeks, a swing partly explained by panel composition changes, not actual performance shifts. If you screenshot one ChatGPT answer on a Tuesday and declare victory or panic, you're reacting to sampling noise. The fix is a fixed cadence, monthly is reasonable, with a stable prompt set, so you're comparing distributions over time instead of single data points. An academic paper from Schulte, Bleeker, and Kaufmann (April 2026) makes the same point bluntly: answers vary across runs, prompts, and time, so one-off observations are unreliable by design.
There's one more wrinkle worth tracking per engine: mention rate and citation rate aren't the same thing, and they diverge differently by platform. Cheers' panel data showed ChatGPT mentioned companies 27.3% of the time but only cited (linked to) them 11.5% of the time, while Perplexity flipped that pattern, mentioning at 16.2% but citing at 23.4%. A dashboard that reports only mentions will rank ChatGPT ahead of Perplexity and completely miss that Perplexity is actually sending you more attributable traffic.
Picking tools: what actually handles 20 locations well
Most general-purpose AI visibility platforms were built brand-first, with per-location reporting bolted on as an afterthought, or not at all. Cheers' vendor matrix found that per-location view is a core capability in only a handful of tools; for most, including some well-known names, it's partial or add-on.
If your 20 locations are the whole point, geo-grid and branch-level tools built for that job will save you time:
Local Falcon prices by scan volume (credits) rather than by location count, which means you can track all 20 locations with unlimited keywords on a single plan. Its Starter tier runs $24.99/mo for 7,500 credits, scaling up to $199.99/mo for over 63,000 credits, and it now tracks AI Overviews, AI Mode, Gemini, ChatGPT, and Grok visibility using the same geo-grid approach it built its reputation on for Google Maps rank tracking.
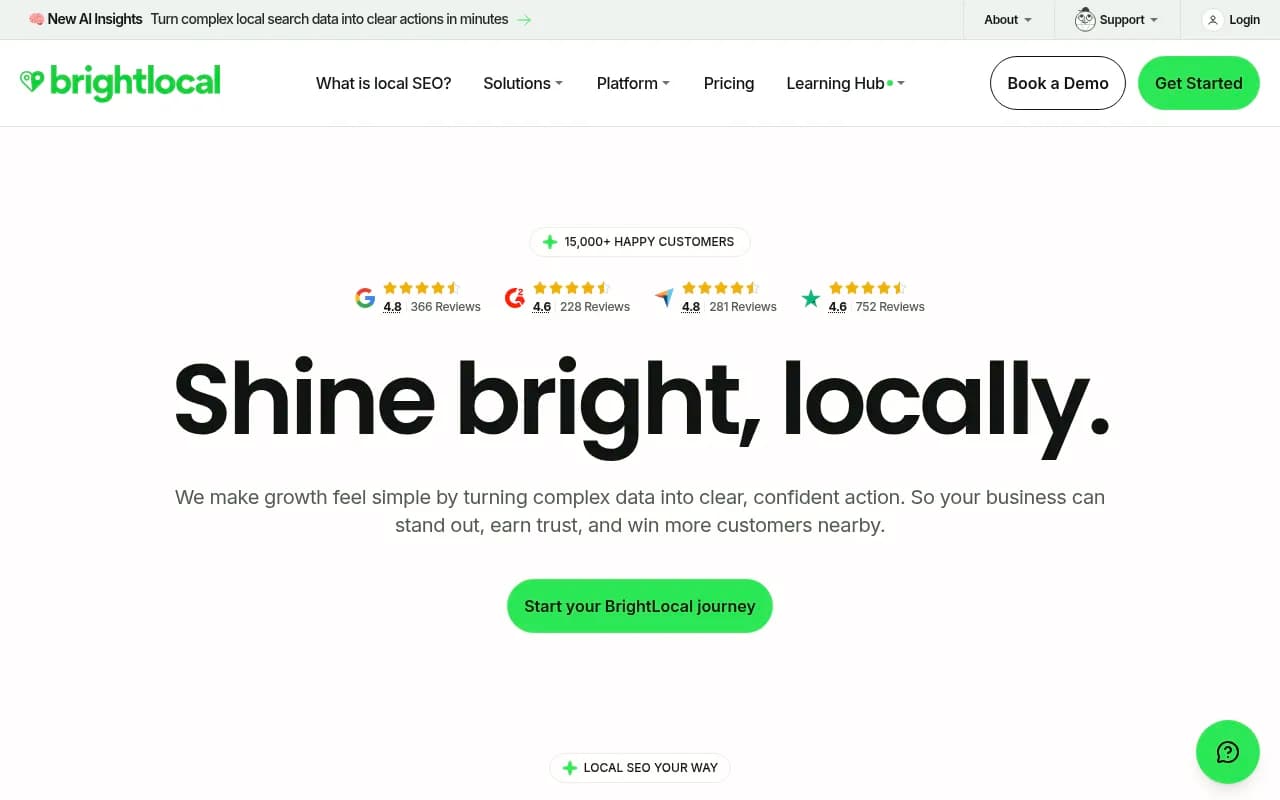
BrightLocal bakes AI visibility into its existing local SEO platform. Its Track plan starts at $31/mo billed annually, with Local AI Visibility covering ChatGPT, AI Overviews, and AI Mode across up to 20 prompts per location, priced in bands as your location count grows.
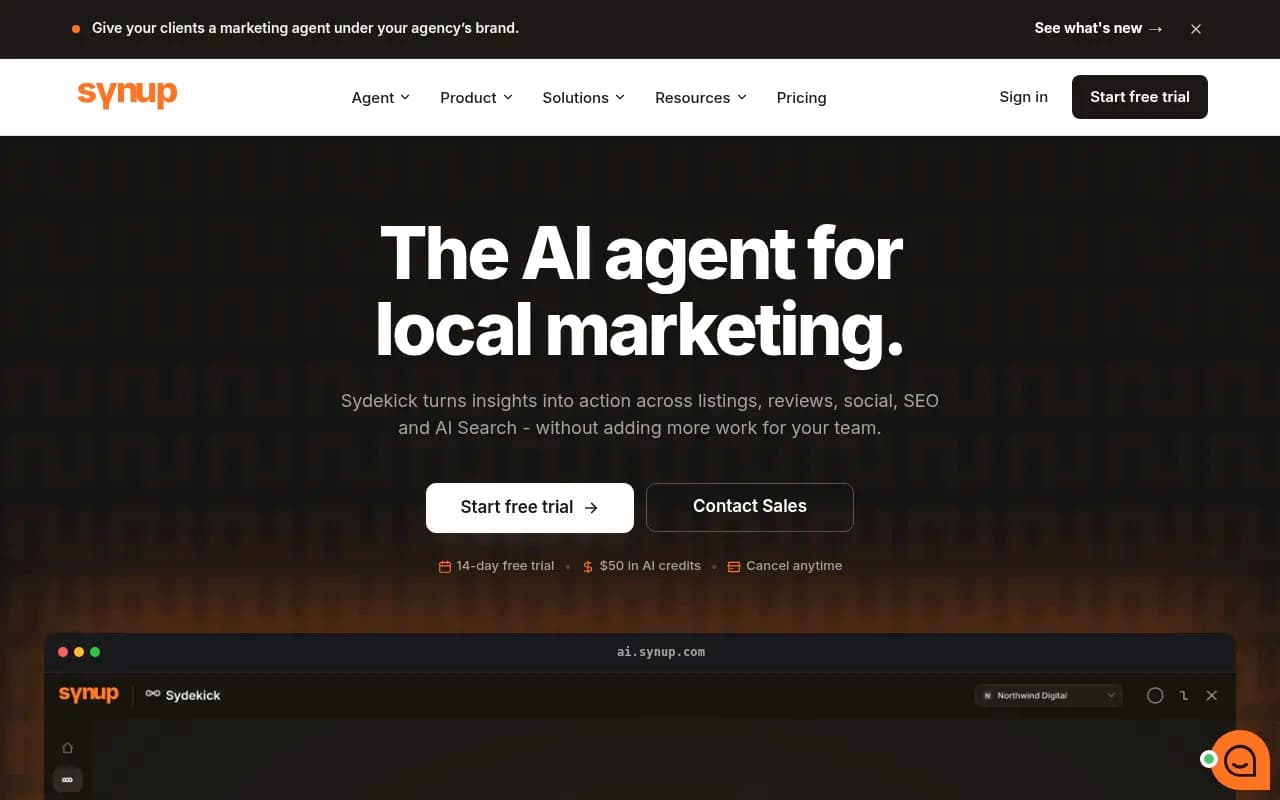
Synup's Pro tier at $499/mo covers up to 25 locations with AEO scoring across ChatGPT, Gemini, and Perplexity, alongside its existing listings and review management, useful if you want visibility tracking inside the same tool that already runs your location data.
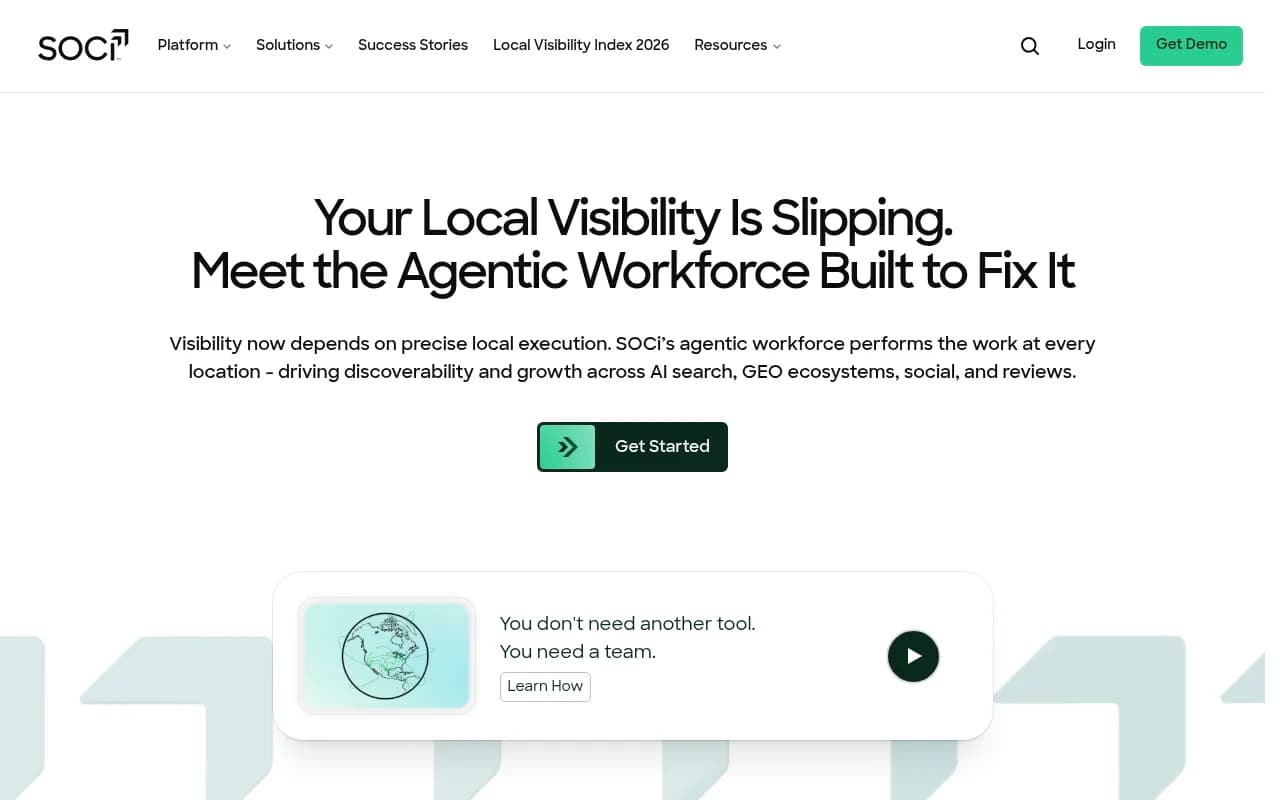
SOCi, the team behind the Local Visibility Index research cited above, built its "% Recommended" metric specifically to measure AI visibility at multi-location scale, testing thousands of locations across industries with a standardized prompt structure per branch.
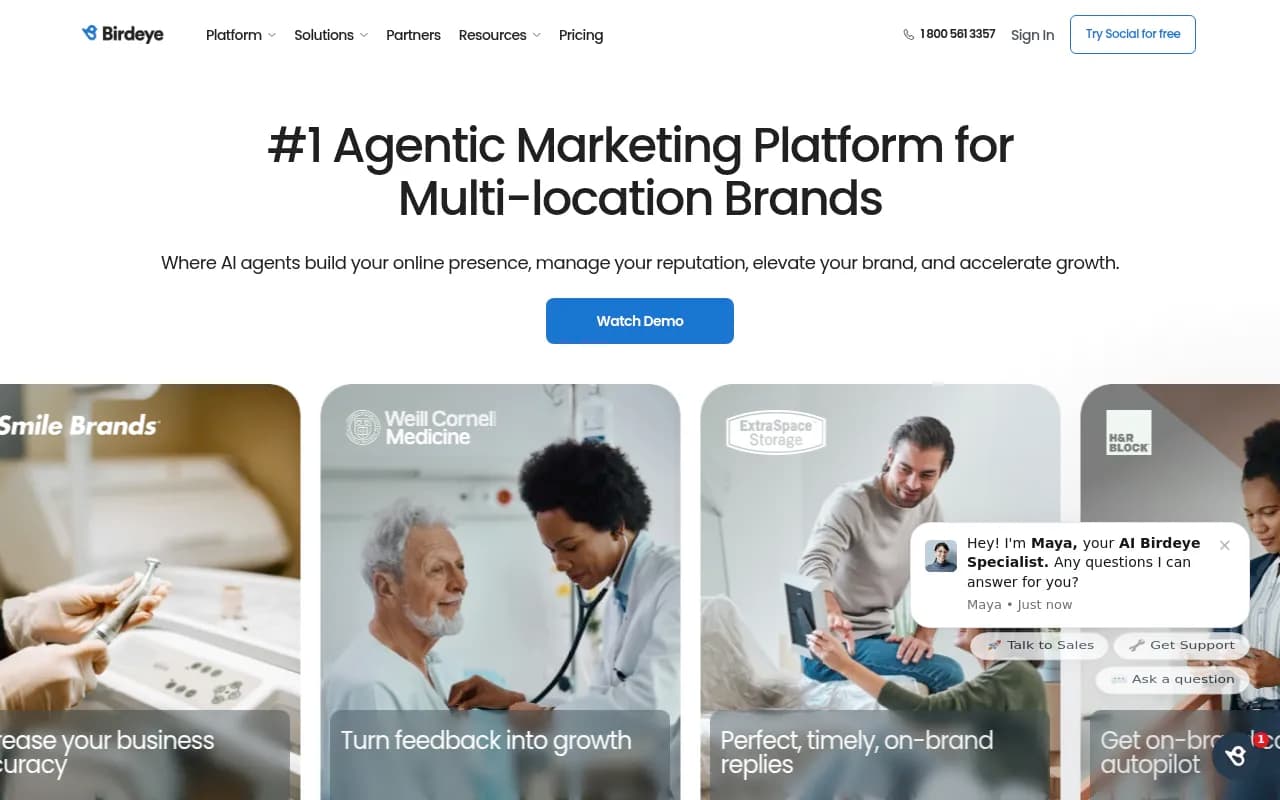
Birdeye frames the problem the same way this guide does: AI answer engines evaluate each location independently, so its platform builds per-location reporting into its enterprise tier, scaling from 100 to 10,000+ locations. Pricing isn't published; it's gated behind a sales form tied to location count.
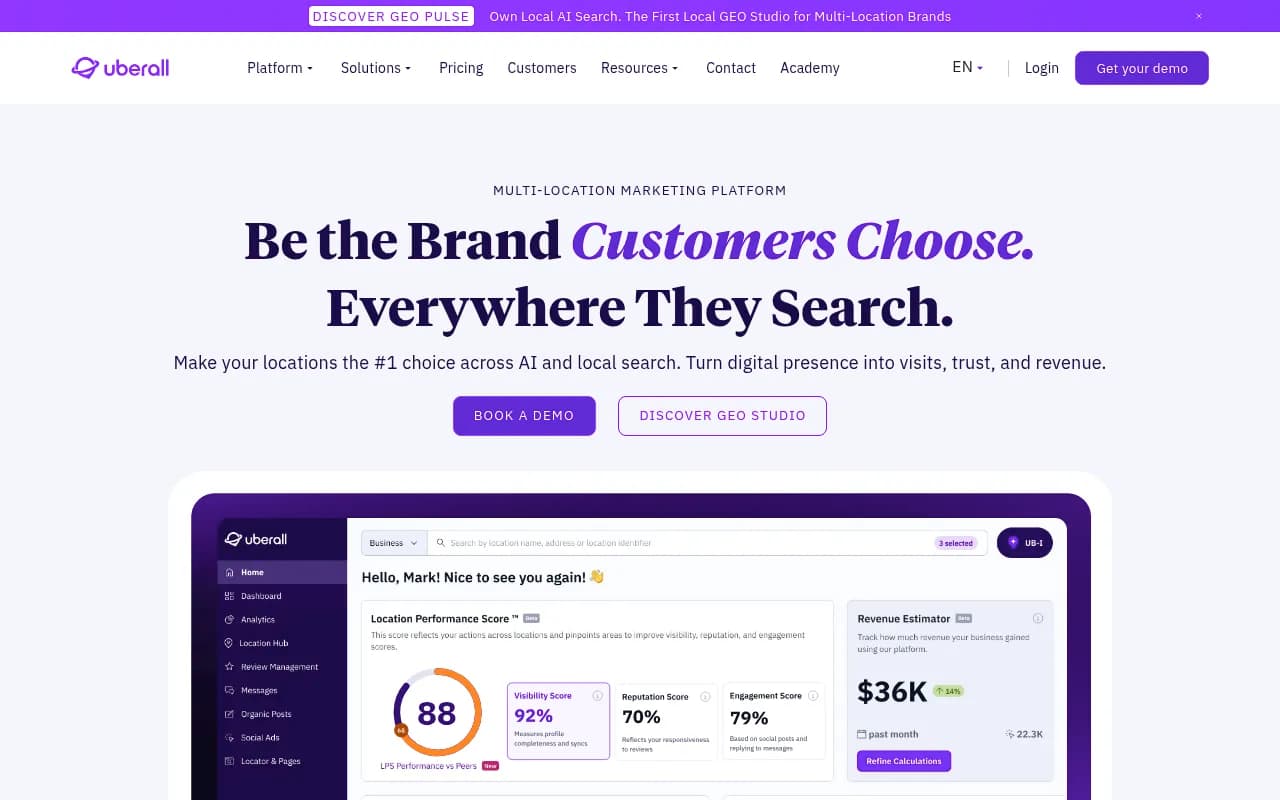
Uberall's GEO Studio Scale tier ($449/mo) adds location-level tracking across five engines and 150 prompts, a middle ground between pure geo-grid tools and full enterprise reputation platforms.
Comparison: location-focused AI visibility tools
| Tool | Pricing model | Engines covered | Per-location view | Best for |
|---|---|---|---|---|
| Local Falcon | Credit-based, $24.99-$199.99/mo | AI Overviews, AI Mode, Gemini, ChatGPT, Grok | Core capability | Geo-grid scans, unlimited locations on any tier |
| BrightLocal | Per-location band, from $31/mo | ChatGPT, AI Overviews, AI Mode | Core capability | Local SEO teams already using BrightLocal |
| Synup | Flat tiers, $499/mo for 25 locations | ChatGPT, Gemini, Perplexity | Partial | Combining listings, reviews, and AI visibility |
| SOCi | Custom/enterprise | Multiple (proprietary Local Visibility Index) | Core capability | Enterprise multi-location brands, 50+ locations |
| Birdeye | Custom, sales-quoted | ChatGPT, Perplexity, Gemini | Core capability | 100 to 10,000+ location enterprises |
| Uberall | Flat tiers, $109-$449/mo | Up to 5 engines on top tier | Partial | Mid-size multi-location brands wanting one platform |
Where this connects to your broader GEO strategy
If you're a brand with 20 physical locations, local AI visibility is one slice of a bigger question: how is your brand showing up across ChatGPT, Gemini, Perplexity, and AI Overviews overall, not just for "near me" queries but for category and comparison prompts too. That's where a broader GEO platform like Promptwatch fits, its prompt intelligence includes state and city-level tracking alongside national monitoring, and its crawler logs show you whether AI bots are even reading your location pages in the first place, which is a question local-only tools can't answer because they don't see your server logs.
Promptwatch's citation share by domain rank data is a useful sanity check for location pages specifically: mid-authority domains (DR 46-75) earned roughly 46% of ChatGPT citations in August 2026, while top-tier domains (DR 91-100) fell to just 3-4%. If your location pages live on your own mid-authority domain, you don't need enterprise-level domain authority to get cited, you need the content and the crawl access to actually be found.
One honest caveat: no Promptwatch report currently segments citation data by physical metro the way Cheers' 100-city study does. That gap is exactly why local-specialist tools like Local Falcon, BrightLocal, and SOCi exist alongside broader GEO platforms, and why the smartest setup for a 20-location brand often pairs a location-grid tool for the branch-level drill-down with a brand-wide GEO platform for everything above it.
Putting it together: a 20-location tracking checklist
- Build one prompt set per vertical using actual buyer language (emergency, replacement, financing, near-me), applied consistently across all 20 markets
- Structure your reporting in three layers: portfolio roll-up, per-market drill-down, per-run citation trail
- Track both mention rate and citation rate per engine, they diverge, and a dashboard reporting only one will mislead you
- Run on a fixed monthly cadence with a stable prompt set, not ad hoc screenshots, since single observations are statistically unreliable
- Pick a tool whose pricing model fits your location count: credit-based tools like Local Falcon scale cleanly across 20+ locations without per-seat penalties, while flat-tier tools cap out at specific location counts you'll need to watch
- Pair a location-specialist tool for the branch-level view with a broader GEO platform for brand-wide prompt coverage and crawler visibility
If you want to browse more options before committing, the GEO software directory at bestgeosoftware.com lists the current field of platforms side by side, which is a faster way to shortlist than reading twenty separate vendor pages.